Measuring the components of maize seeds
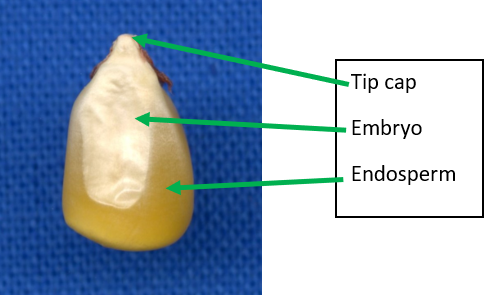
On the surface of maize (Zea mays) seeds, areas of the embryo and the endosperm are visible, and fractions of these parts differ between maize cultivars. In yellow-seeded varieties, endosperm areas are darker-yellow, whereas the embryo areas are light-yellow to brown. Moreover, a tip cap is visually distinguishable.
Endosperm mainly consists of starch, thus kernels with large fractions of endosperm are starch-rich, while those with lower endosperm fractions deliver less starch per kernel.
An analysis of the fraction of the different parts is nearly impossible by visual scoring, in particular when analysing large numbers of seeds. LemnaTec analytical software makes such an analysis possible in a high-throughput manner.
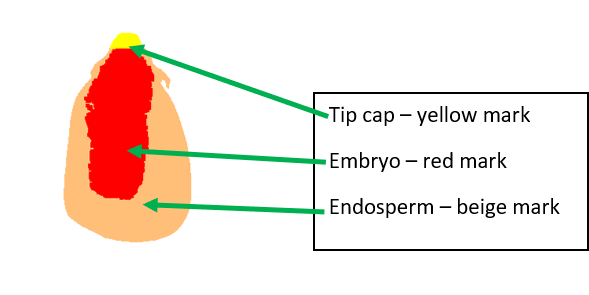
LemnaTec analytical software detects and quantifies the area of the three parts, so that statistics on seed properties are feasible. Colour analysis of the seed images provides separate area data for the different parts.
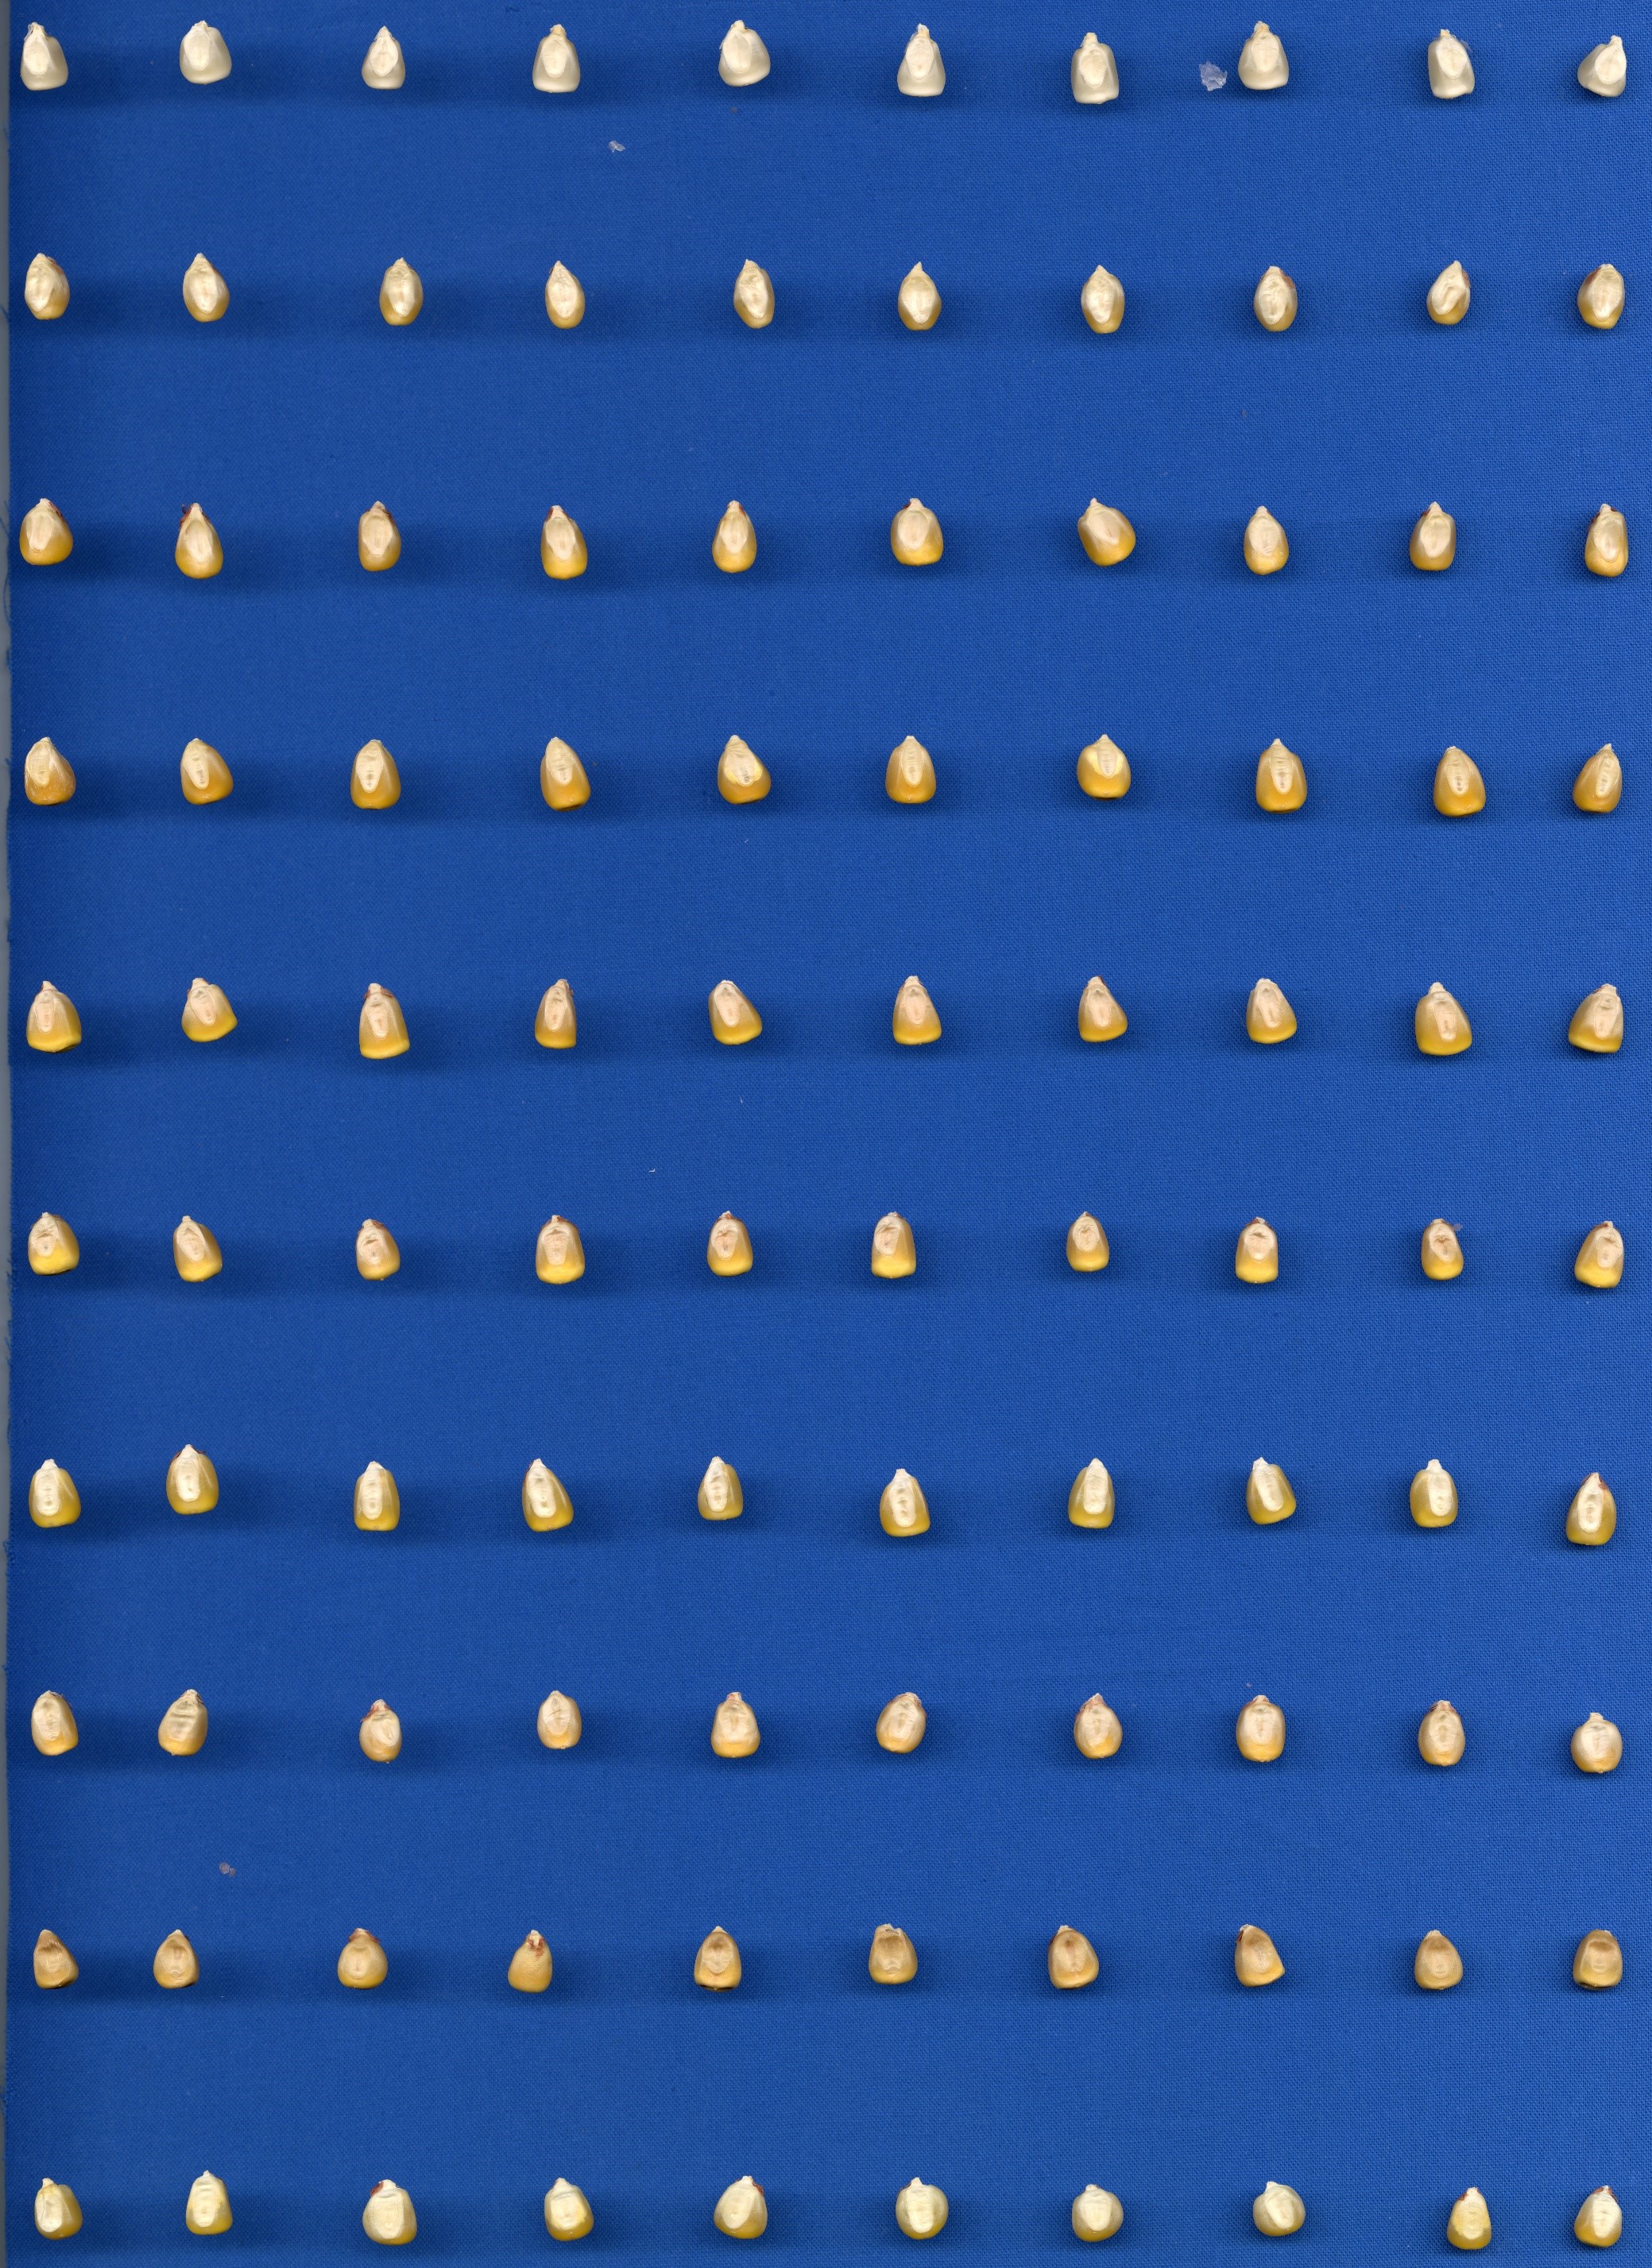
In a study of 190 different maize genotypes, 10 kernels per line – in total 1900 kernels – were analysed via image processing. LemnaTec analytical software detected the embryo-areas in the kernels and calculated the fractions of the different parts in each kernel.


In this case study, kernels were analysed in a high-throughput manner and data on endosperm fractions became available rapidly for hundreds of seeds.
Fractions of embryo area varied between 20% and 50% of the kernel, with an average of 37%. Endosperm varied between 50% and 80% of the kernel area, having an average of 61%. Tip caps finally had 1% – 2% of the area.
Among the genotypes, there were some having nearly equal fractions of embryo and endosperm but also others where the embryo was markedly smaller than the endosperm was. Beyond this between-genotype variability, we also measured within-genotype variability. In some genotypes the kernel properties were homogeneously distributed, but in others there was a substantial kernel-to-kernel variability. The example shows Genotype 1 having nearly equal fractions of embryo and endosperm with low kernel-to-kernel variability. In contrast, Genotype 2 has high kernel-to-kernel variability and comparably small embryo- but large endosperm- fractions.


Comparing all genotypes in the test by their endosperm content, i.e. the source of starch, genotypes ranged between 50% and 80% Thereby the genotypes were classified as poor to rich in endosperm. Seeds of the different genotypes varied in their overall size, meaning that some genotypes had small and other large kernels. Together with the fraction of embryo and endosperm per kernel in each genotype, conclusions on the amount of starch per kernel can be done.


