How does Phenotyping work?
Dimensions, morphology & colour
Phenotypes are those properties of organisms that make up their appearance, essentially dimensions, morphology, and colour. Structural compounds and pigments determine the organism’s phenome, i.e. the sum of all phenotypic properties. Plant phenotyping means measuring these properties in qualitative and quantitative ways.

Plant Phenotyping; Genome-Environment-Interaction

The phenome results from various physiological processes which are governed by the genome of the organism and influenced by the environment the organism lives in. Phenotyping is an essential tool when analysing genomic effects and environmental responses. In current science, genotype-phenotype links sit at the centre of plant research.
Plants adapt to the environment in which they grow and environmental factors influence the plants’ phenotypes. This means that plants with the same genomic properties, grown in different environments, can differ greatly in phenotypic properties.
Automated systems
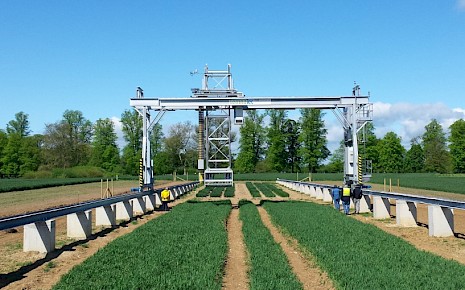
In agriculture, changes of phenotypic appearance are indicative of crop performance during cultivation and therefore phenotypic data provides the basis for decisions on crop management. Modern systems use automated, non-invasive sensors to record data on phenotypes which is then translated into numerical parameters by means of dedicated phenotyping software. The software uses mathematical models to translate measured parameters into biological data.

Large proportions of the phenotypic information can be derived from colour images (visual RGB), where phenotyping software can derive data on dimensions, morphology, and colour. Such parameters are indicative of growth and biomass, which are derived from dimensional data.
Growth, i.e. the temporal development of dimensions, is highly indicative of stress because any stress factor causes growth depression in the short term. Morphology and colour data can be used to derive information on the physiological state, e.g. water and fertiliser supply or infestation. Colour data can also be indicative of pigment content


Non-visible spectra
For physiological assessments, non-visible wavelengths or fluorescent light deliver additional information, e.g. infrared to indicate heat emission or chlorophyll fluorescence to interpret photosynthetic processes. Fluorescence signals can serve as a measure for stress or senescence and they indicate presence of fluorescent biomarkers.
Structural and dimensional data can be gained from laser scanners that provide more detail than pure image analysis. Spectrally resolved images covering visible and non-visible wavelengths deliver large datasets that can be analysed to derive physiological properties by means of vegetation indices or data mining methods.

Dr. Marcus Jansen
Chief Scientist – Biologist
