The versatile phenotyping system for laboratories – advanced phenotyping of growing plants.
Application examples
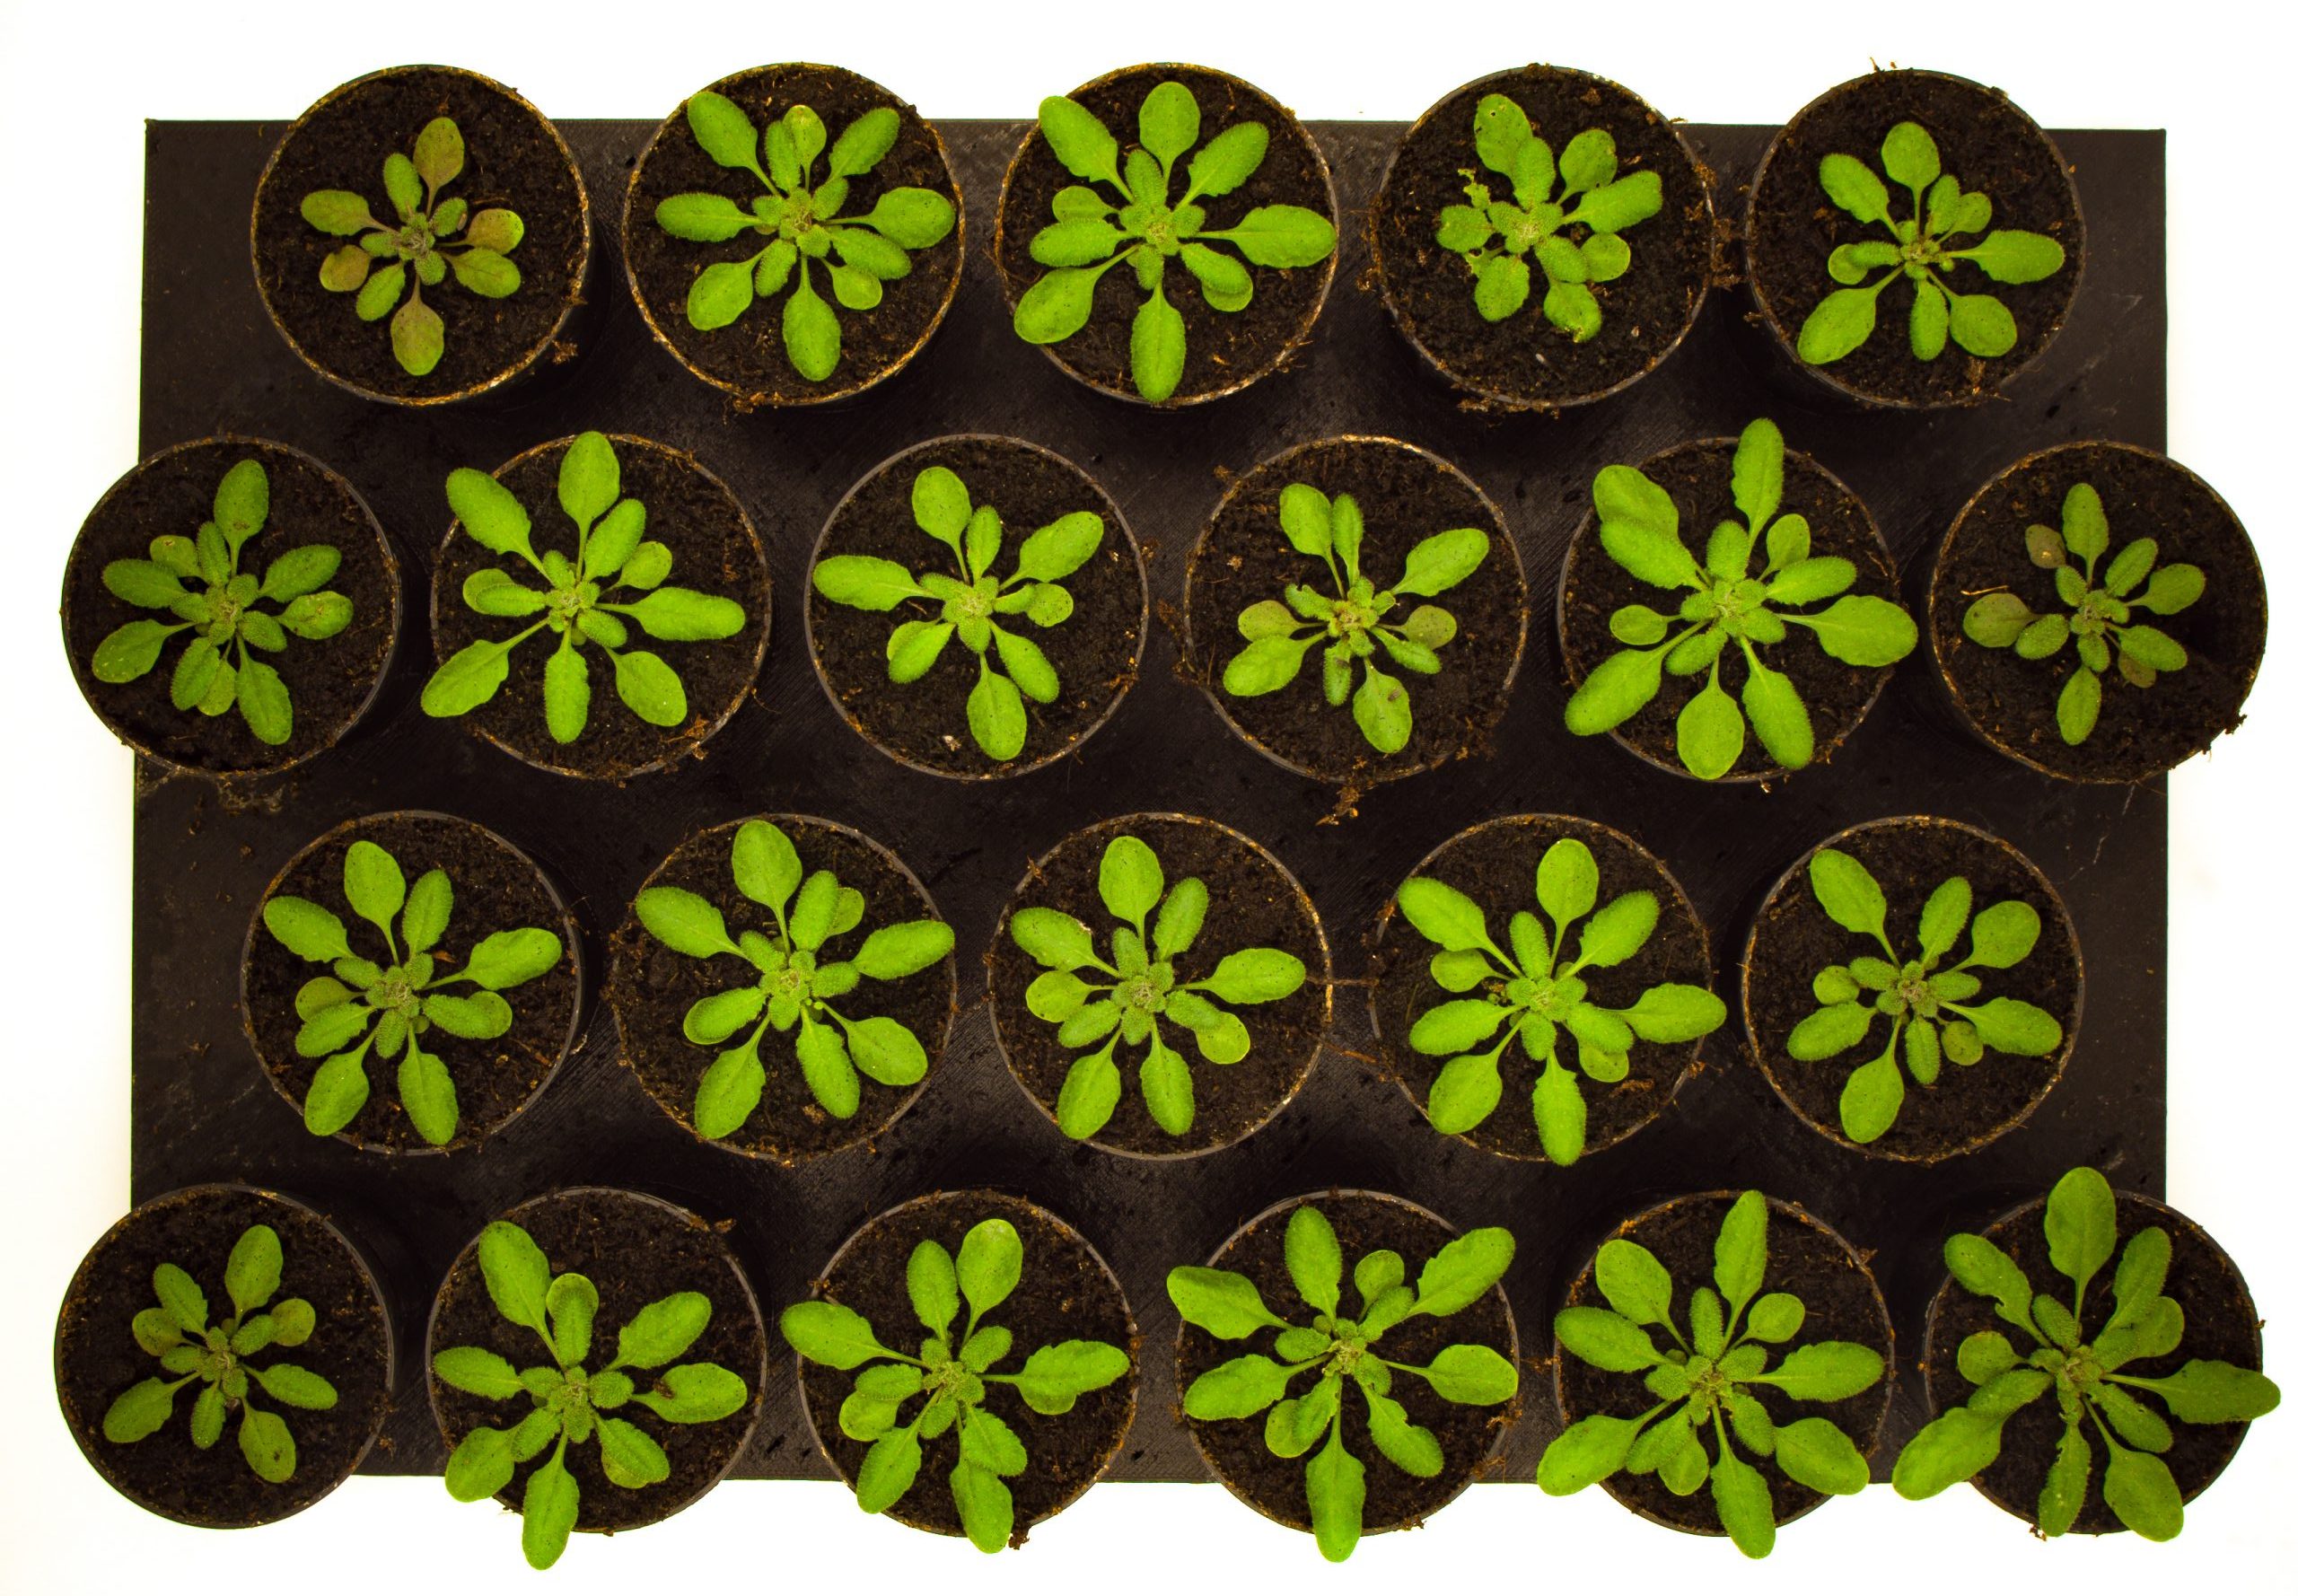
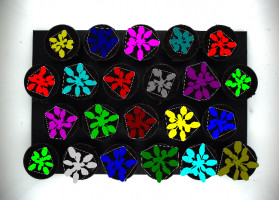
Arabidopsis growth assay
Trays with growing Arabidopsis plants were imaged with PhenoAIxpert and images were processed for plant growth, morphology and color. Individual plants were identified and phenotypic properties of their visible plant area were assessed. Such tests serve for e.g. candidate screening, genetic studies, treatment effects, environmental responses
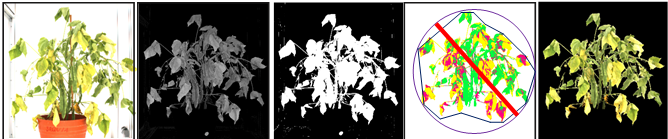
Bean Phenotyping
Bean plants were exposed to stress and phenotyped for stress responses. Images were recorded and processed with PhenoAIxpert Pro. This system enables vertical and horizontal multi-view imaging. Phenotypic traits comprise growth, morphology, and color analysis, e.g. as stress indicator for chlorosis and necrosis.
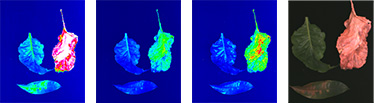
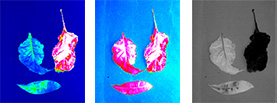
Multispectral imaging example with intact leaf (left) dead dry leaf (right) and stress-damaged leaf (bottom)
Red, green, and blue channel imaging – color-coded visualization of reflectance, channels allow calculating RGB images.
Multispectral imaging example with intact leaf (left) dead dry leaf (right) and stress-damaged leaf (bottom)
Combining red and infrared image (color-coded visu-alization of reflectance) to NDVI image (greyscale in-tensity of NDVI values: light-grey high NDVI, dark-grey low NDVI)
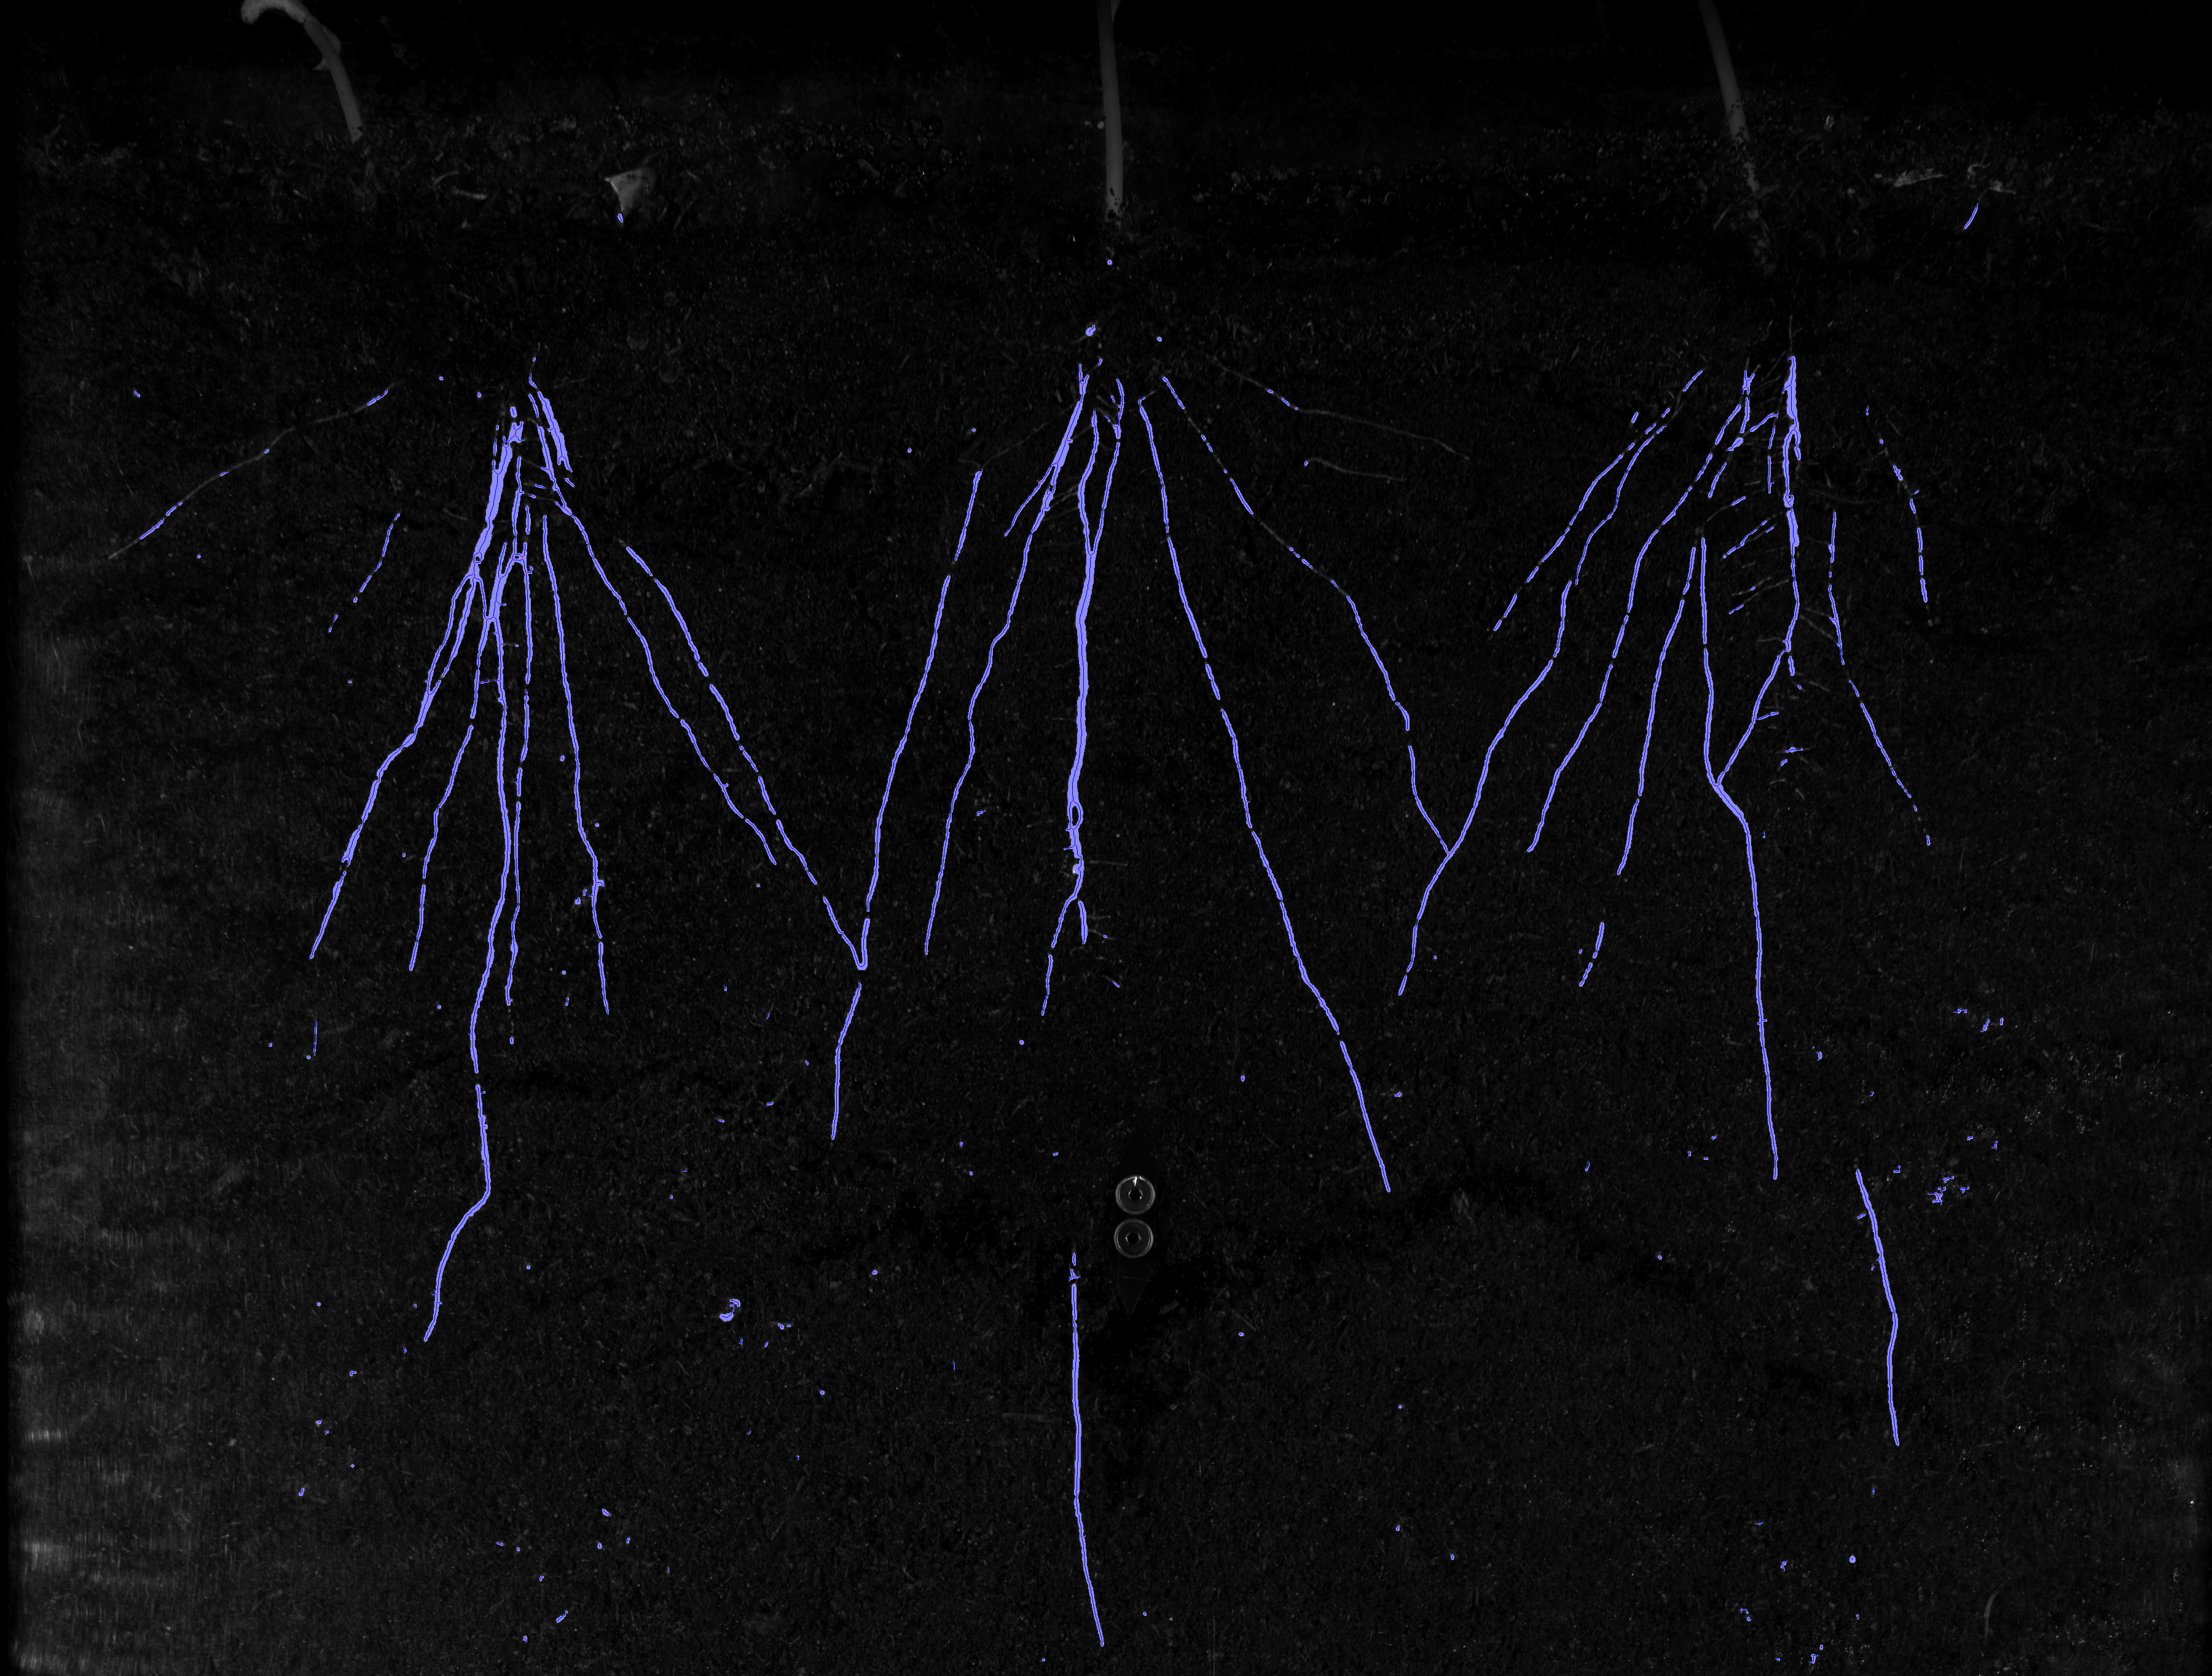
Root Phenotyping
Using the PhenoAIxpert Root, traits of soil-grown roots in rhizotrons can be measured. Root properties like root lenght, root density, or root system lenght and width can be assessed.

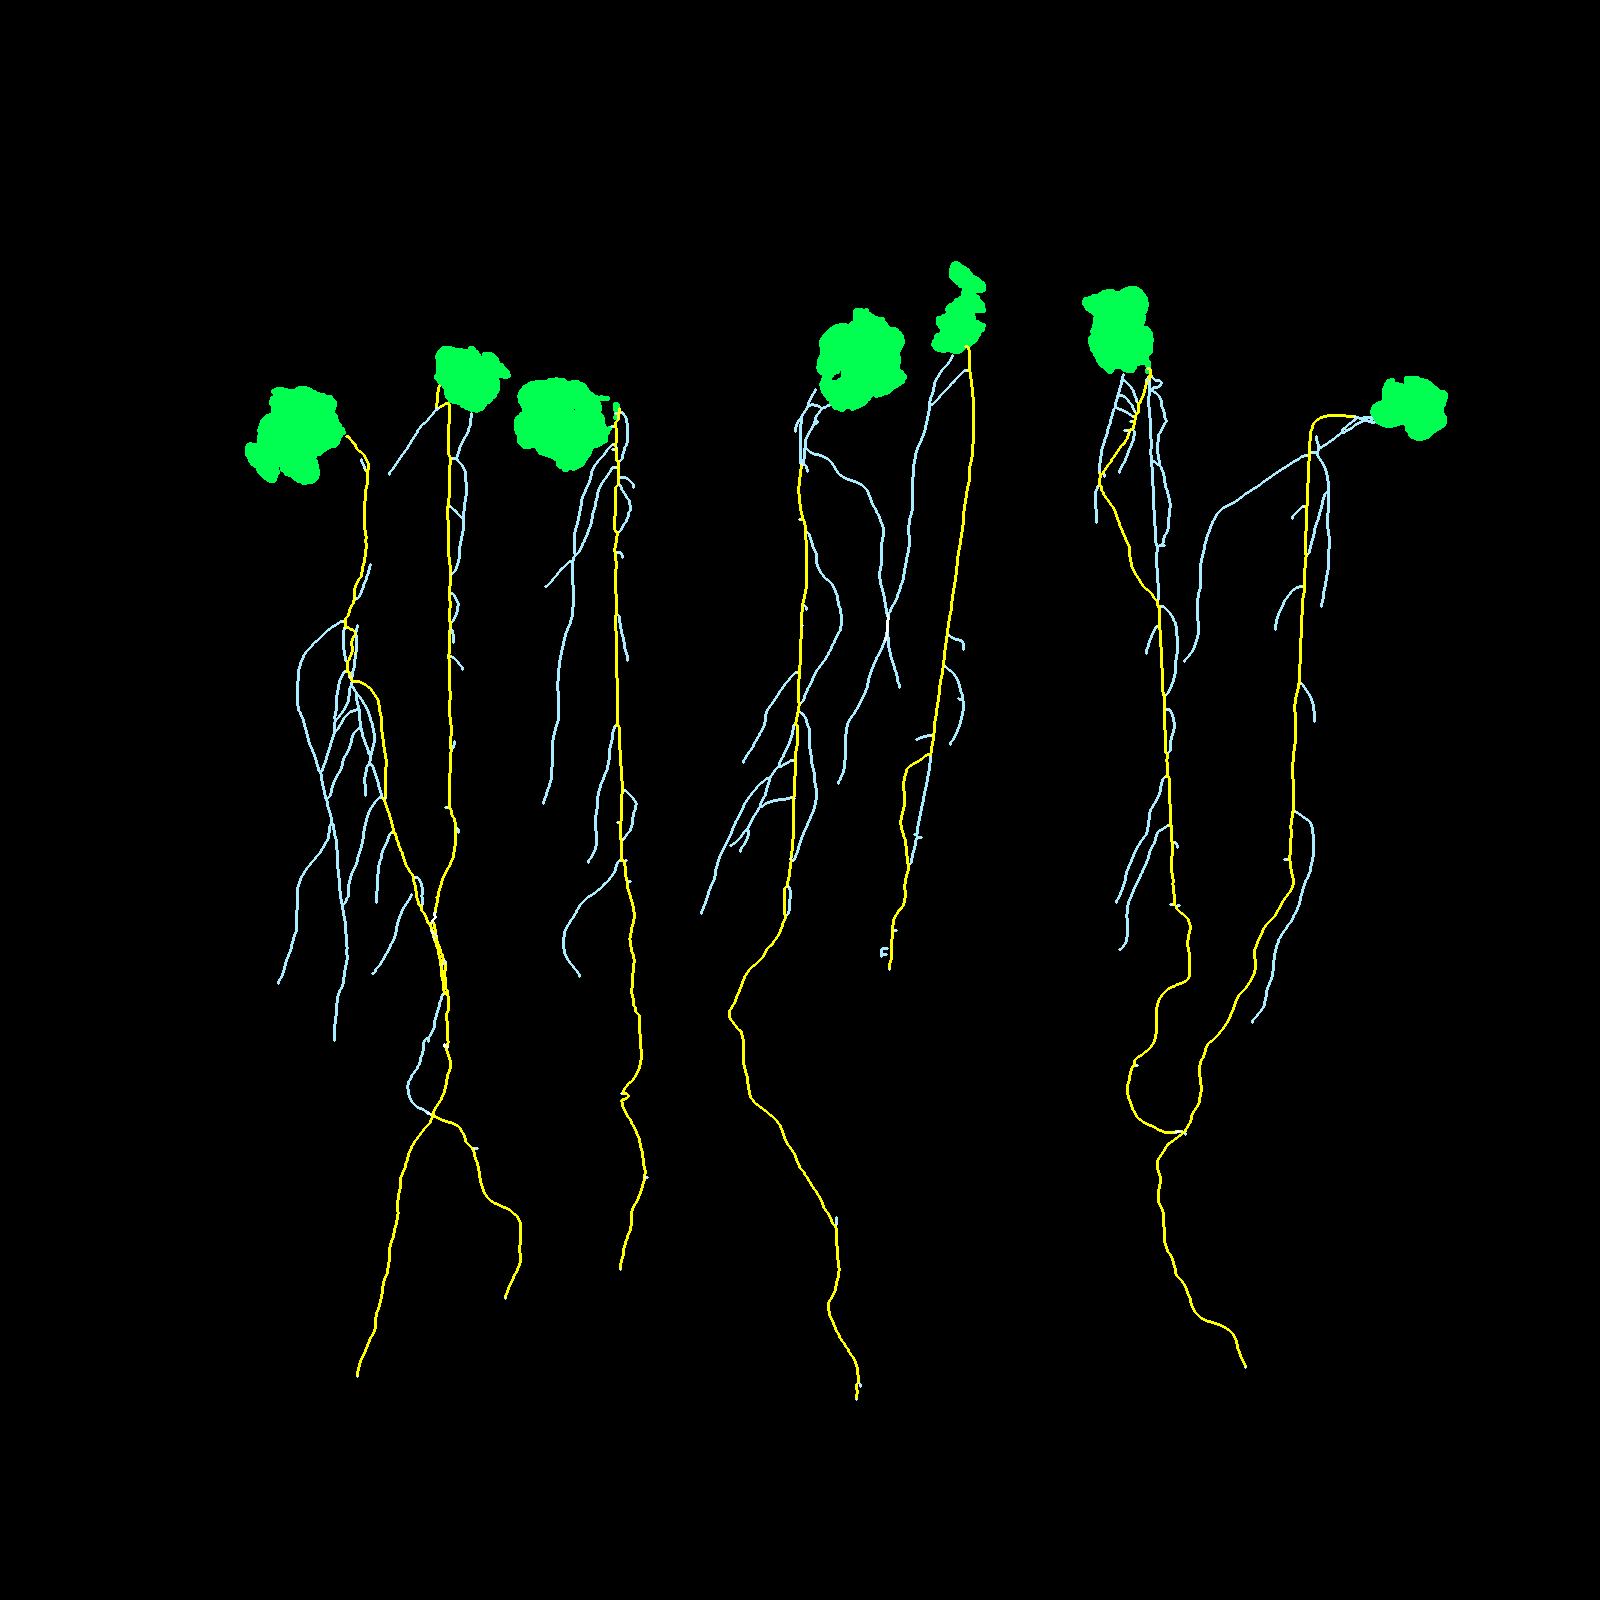
Phenotyping of seedlings on petri dish
Assessing shoot and root traits of agar-grown seedlings with PhenoAIxpert: shoots and roots are recognized separately and measured for their individual size. In the current example, primary root length, secondary root length, and shoot area were measured for each seedling.

Features
Technical Data

Optional Accessories for PhenoAIxpert Pro
Imaging and Lighting Options
Standard RGB imaging
Multispectral and fluorescence imaging options for the PhenoAIxpert family
Multispectral and fluorescence imaging is available for PhenoAIxpert shoot imaging using multi-channel LED
panels combined with a dedicated camera and filter system.

 In a typical setup, the LED array consists of UV, blue, green, yellow, red, deep red, far red and near-infrared wavelength LEDs. Thereby, an advanced analysis of the red edge is enabled as different images in the red range are provided and can be used for ratio calculation. The filter wheel enables filtering for reflectance or fluorescence, e.g. in the chlorophyll fluorescence range.
Multi-channel LED illumination combined with filters enables various imaging settings
We bought a LemnaTec LabScanalyzer (the predecessor of PhenoAIxpert) in July 2018. The instrument was delivered to us and installed remotely by a Lemnatec technician that instructed us about the use of the instrument. We were happy about the service: very good communication and excellent instrument set-up. The Lemnatec LabScanalyzer works nicely and is even more user-friendly than we expected. Almost no training of new users is needed. We hope to expand the uses of the instrument to obtain additional phenotyping options in the future, by interacting with LemnaTec.
LemnaTec Product Matrix
LemnaTec offers imaging and image processing technologies for several applications that suit for low to high throughput in laboratory, greenhouse or outdoor environments. Technologies are adapted to various sample types and can be combined with automation. All imaging systems are combined with dedicated image processing software, including user-programmable functions and machine learning.
