The advantage of digital phenotyping in environmental stress assessment
Abiotic stresses have large potential of damaging plants, and this is one of the major threats in crop production. Detecting and quantifying stress effects gives a strong advantage in rating plant performance and stress tolerance. Digital phenotyping gives rapid access to a range of parameters that quantify stress-induced modification of plant performance. Digital measuring is superior to visual-manual scoring at multiple levels, because it delivers numerical quantification instead of subjective impressions that are prone to vary among investigators.
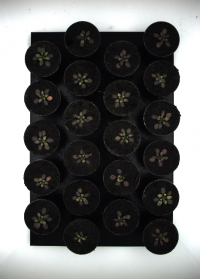
In our example, two groups of plants – for simplification reasons we chose Arabidopsis – were cultivated in either a non-stressing environment or in a stressful environment. Visually scoring of the outcome results with the statement that stressed plants stayed smaller and had red to yellow leaf colour compared to not stressed plants.
Such very descriptive data are not helpful when quantifying effects of a stress type or a range of stress factors, and responses of different genotypes. Classical methods such as biomass weighing give numerical data, of course, but they are laborious and destructive. In our example, investigators would not be able to do follow-up work with the plants, e.g. look for recovery.
In contrast, non-invasive digital measures allow standardising the measures by translating the phenotypic properties into numbers.
Image processing of the input images results in finding the plants and separating them from the background. In a second step, each plant is measured for dimensions, colours, and morphological factors. Data not only come in a digital way, but they also comprise values that are not accessible (e.g. morphological factors) when doing visual inspections only.
In the case study, LemnaTec analytical software detected the plants of the control and stress groups in the images and analysed each of them for size, morphology, and colour.
The numerical output of these assessments is a quantification of the stress effects. This means not only seeing that plants stayed smaller but having a dataset of the size differences ready for statistical analysis.
In the first week of stress, differences were still small, and variation among plants was low, but in the third week, the plants in control group were more than double the size in average compared to the stress group, and control plants had a stronger variability in individual sizes. Thus, the stress impaired plant growth and development.


Usually plants are green but seeing a plant no one can tell how green a plant is. The digital colour analysis results in a greenness value, and comparing stressed plants to control plants, shows that greenness values already tend to decrease in the first week, but strongly decrease in the third week of stress. This is in accordance with the visual impression that stressed plants turn yellow-red, but only the digital analysis allows to quantify the severity of colour change.
As the green is related to chlorophyll, stress-related discoloration indicates loss of chlorophyll and thus reduced capacity for photosynthesis. This in turn contributes to the sowed-down growth of the stressed plants.
Finally, morphology, a factor that one might see when comparing plants but is usually even harder to describe in words, can be digitised into numbers, too.
Stress made plants more eccentric, and the effect was stronger in the early phase of the stress compared to the later phase. The eccentricity factor calculates whether the visible parts of the plants are equally spaced around the center of gravity or not – unequal distribution makes the plant eccentric. While such is barely visible for the human eye, a digital analysis reveals additional parameters that give indication for the plant responding to the environment.


