A common practice in laboratory tests, e.g. when studying functions of mutations, is growing seedlings on solid media in petri dishes. Such growth assays serve to compare phenotypic properties of mutants and wild types in an easy and fast manner. The phenotypic differences between mutants and wild types are essential factors in describing the gene functions that underly the respective mutations. Thus, it is important to properly document the phenotypes and to measure the occurring differences in a numerical way. In most cases, a simple description in words does not fully capture the entity of the phenotype and descriptive comparisons might be influenced by personal impressions of the experimenter. Image-based phenotyping provides both, a traceable documentation, and a numerical quantification of the essential traits.
In the current example, a mutant was tested for growth effects. After cultivating the seedlings of mutant and wild type on agar media in petri dishes, growth of shoot and root was compared.
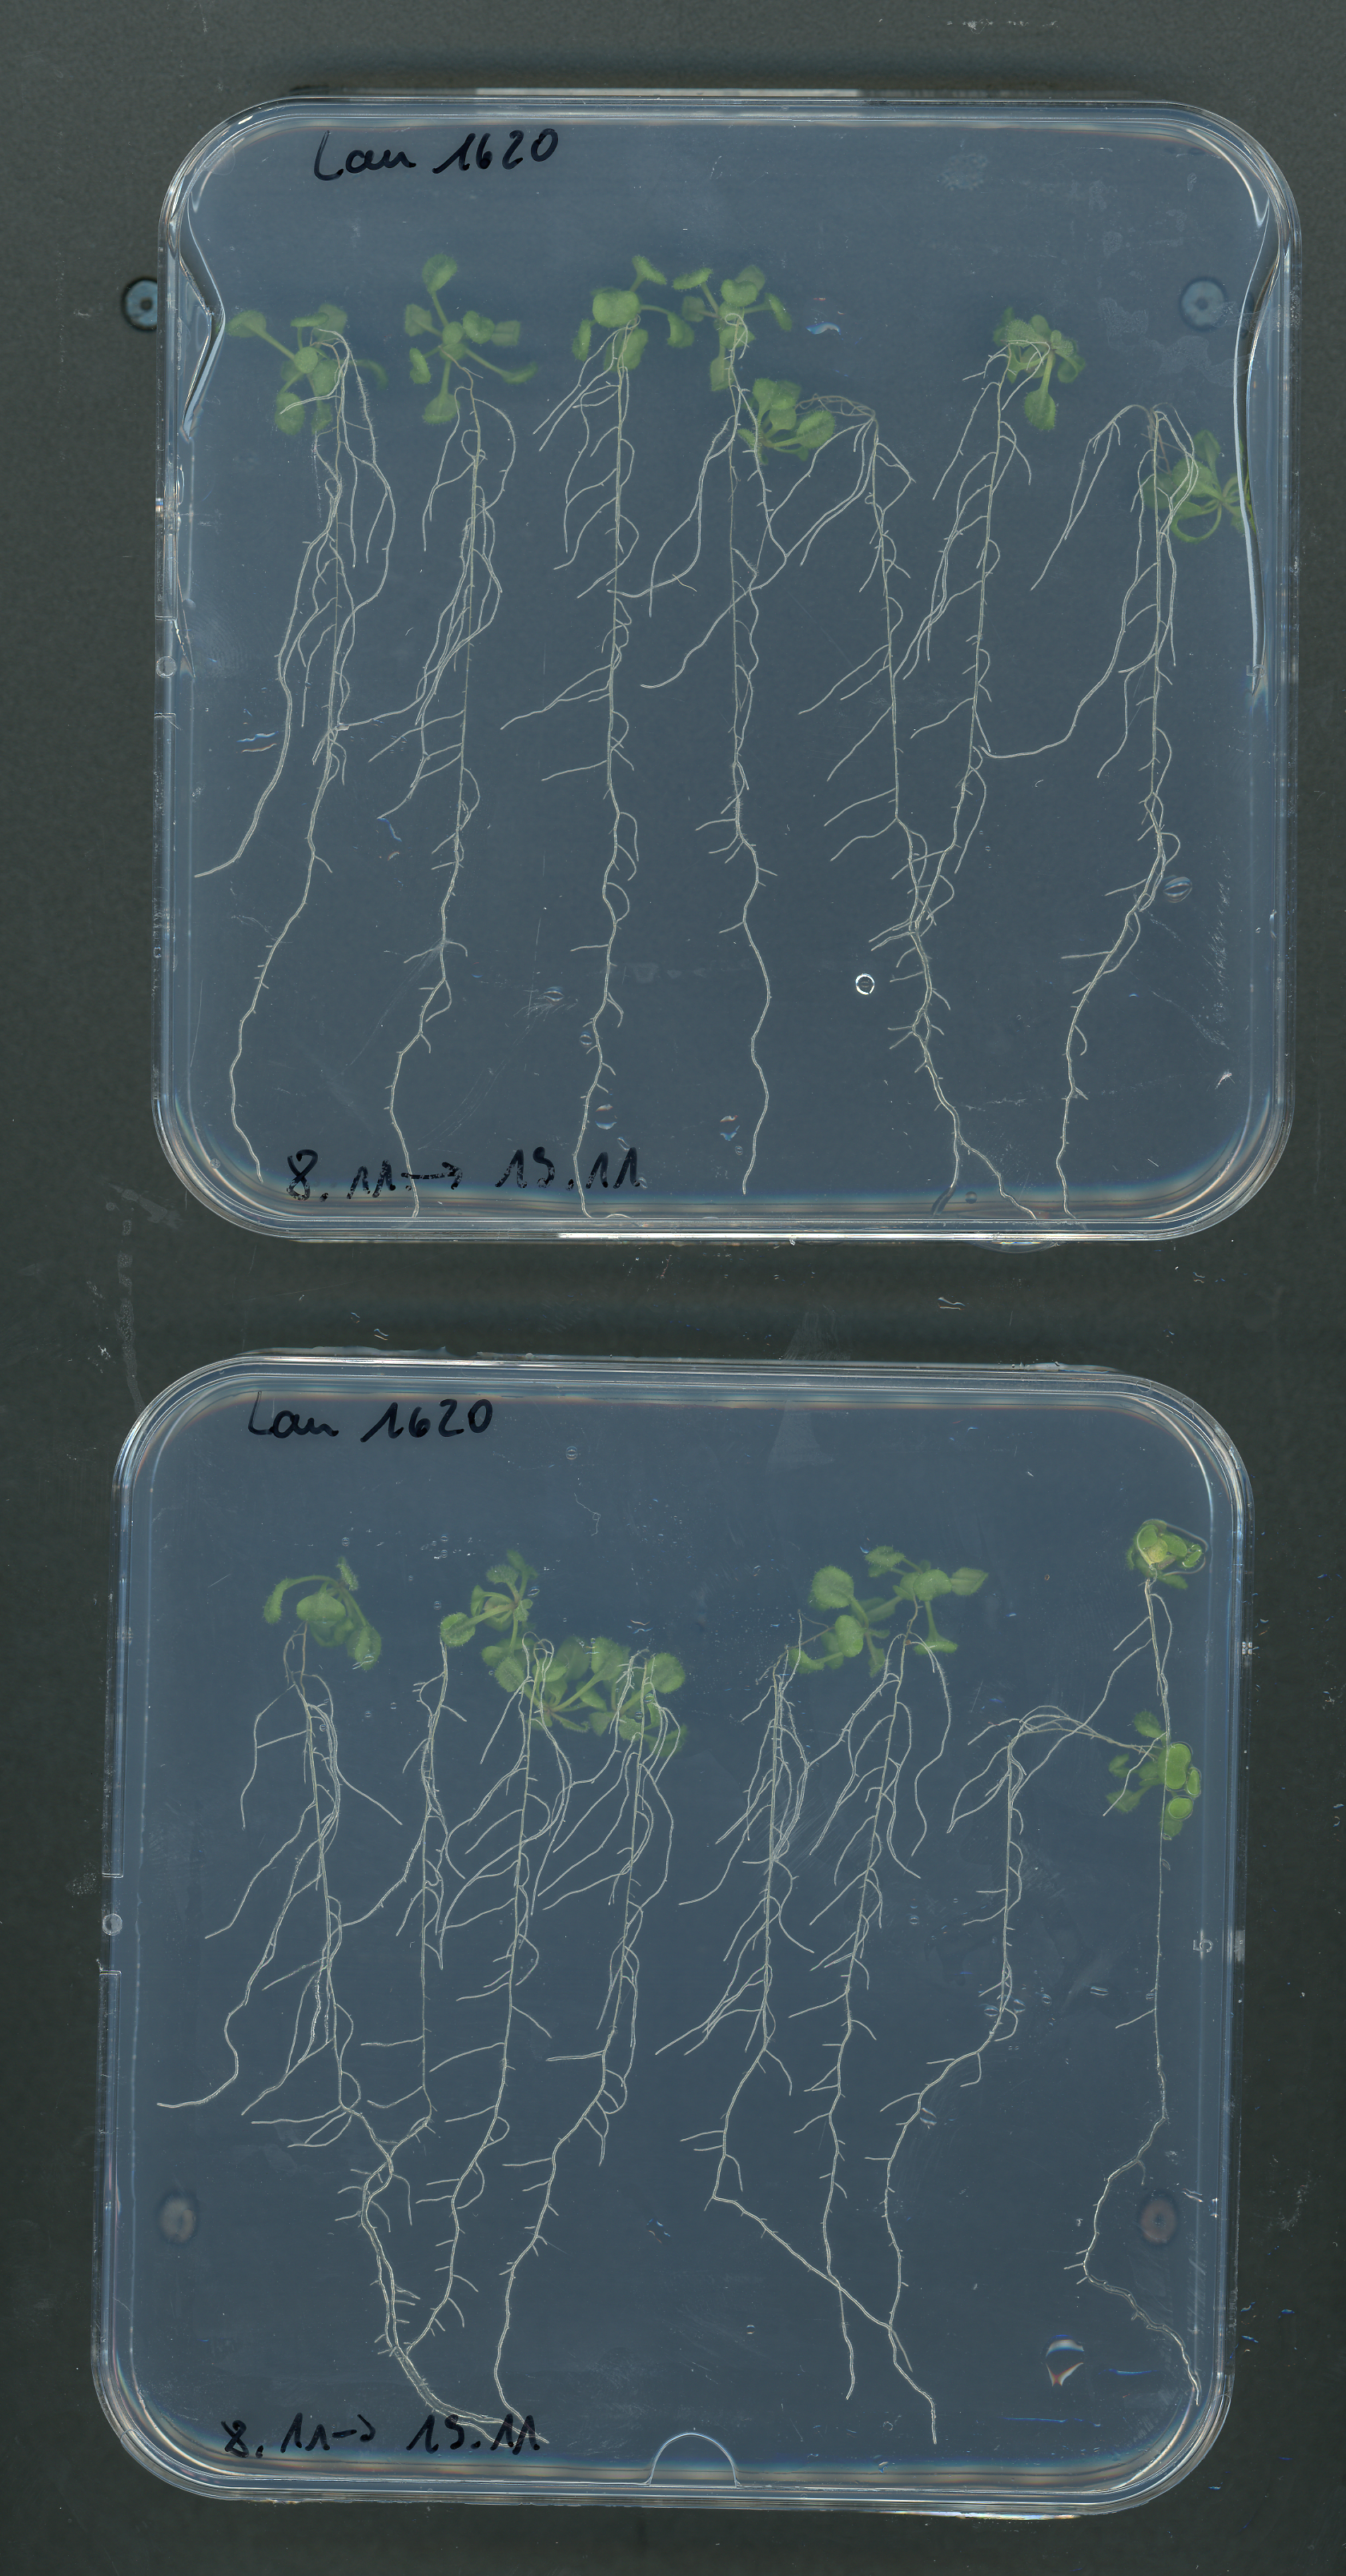
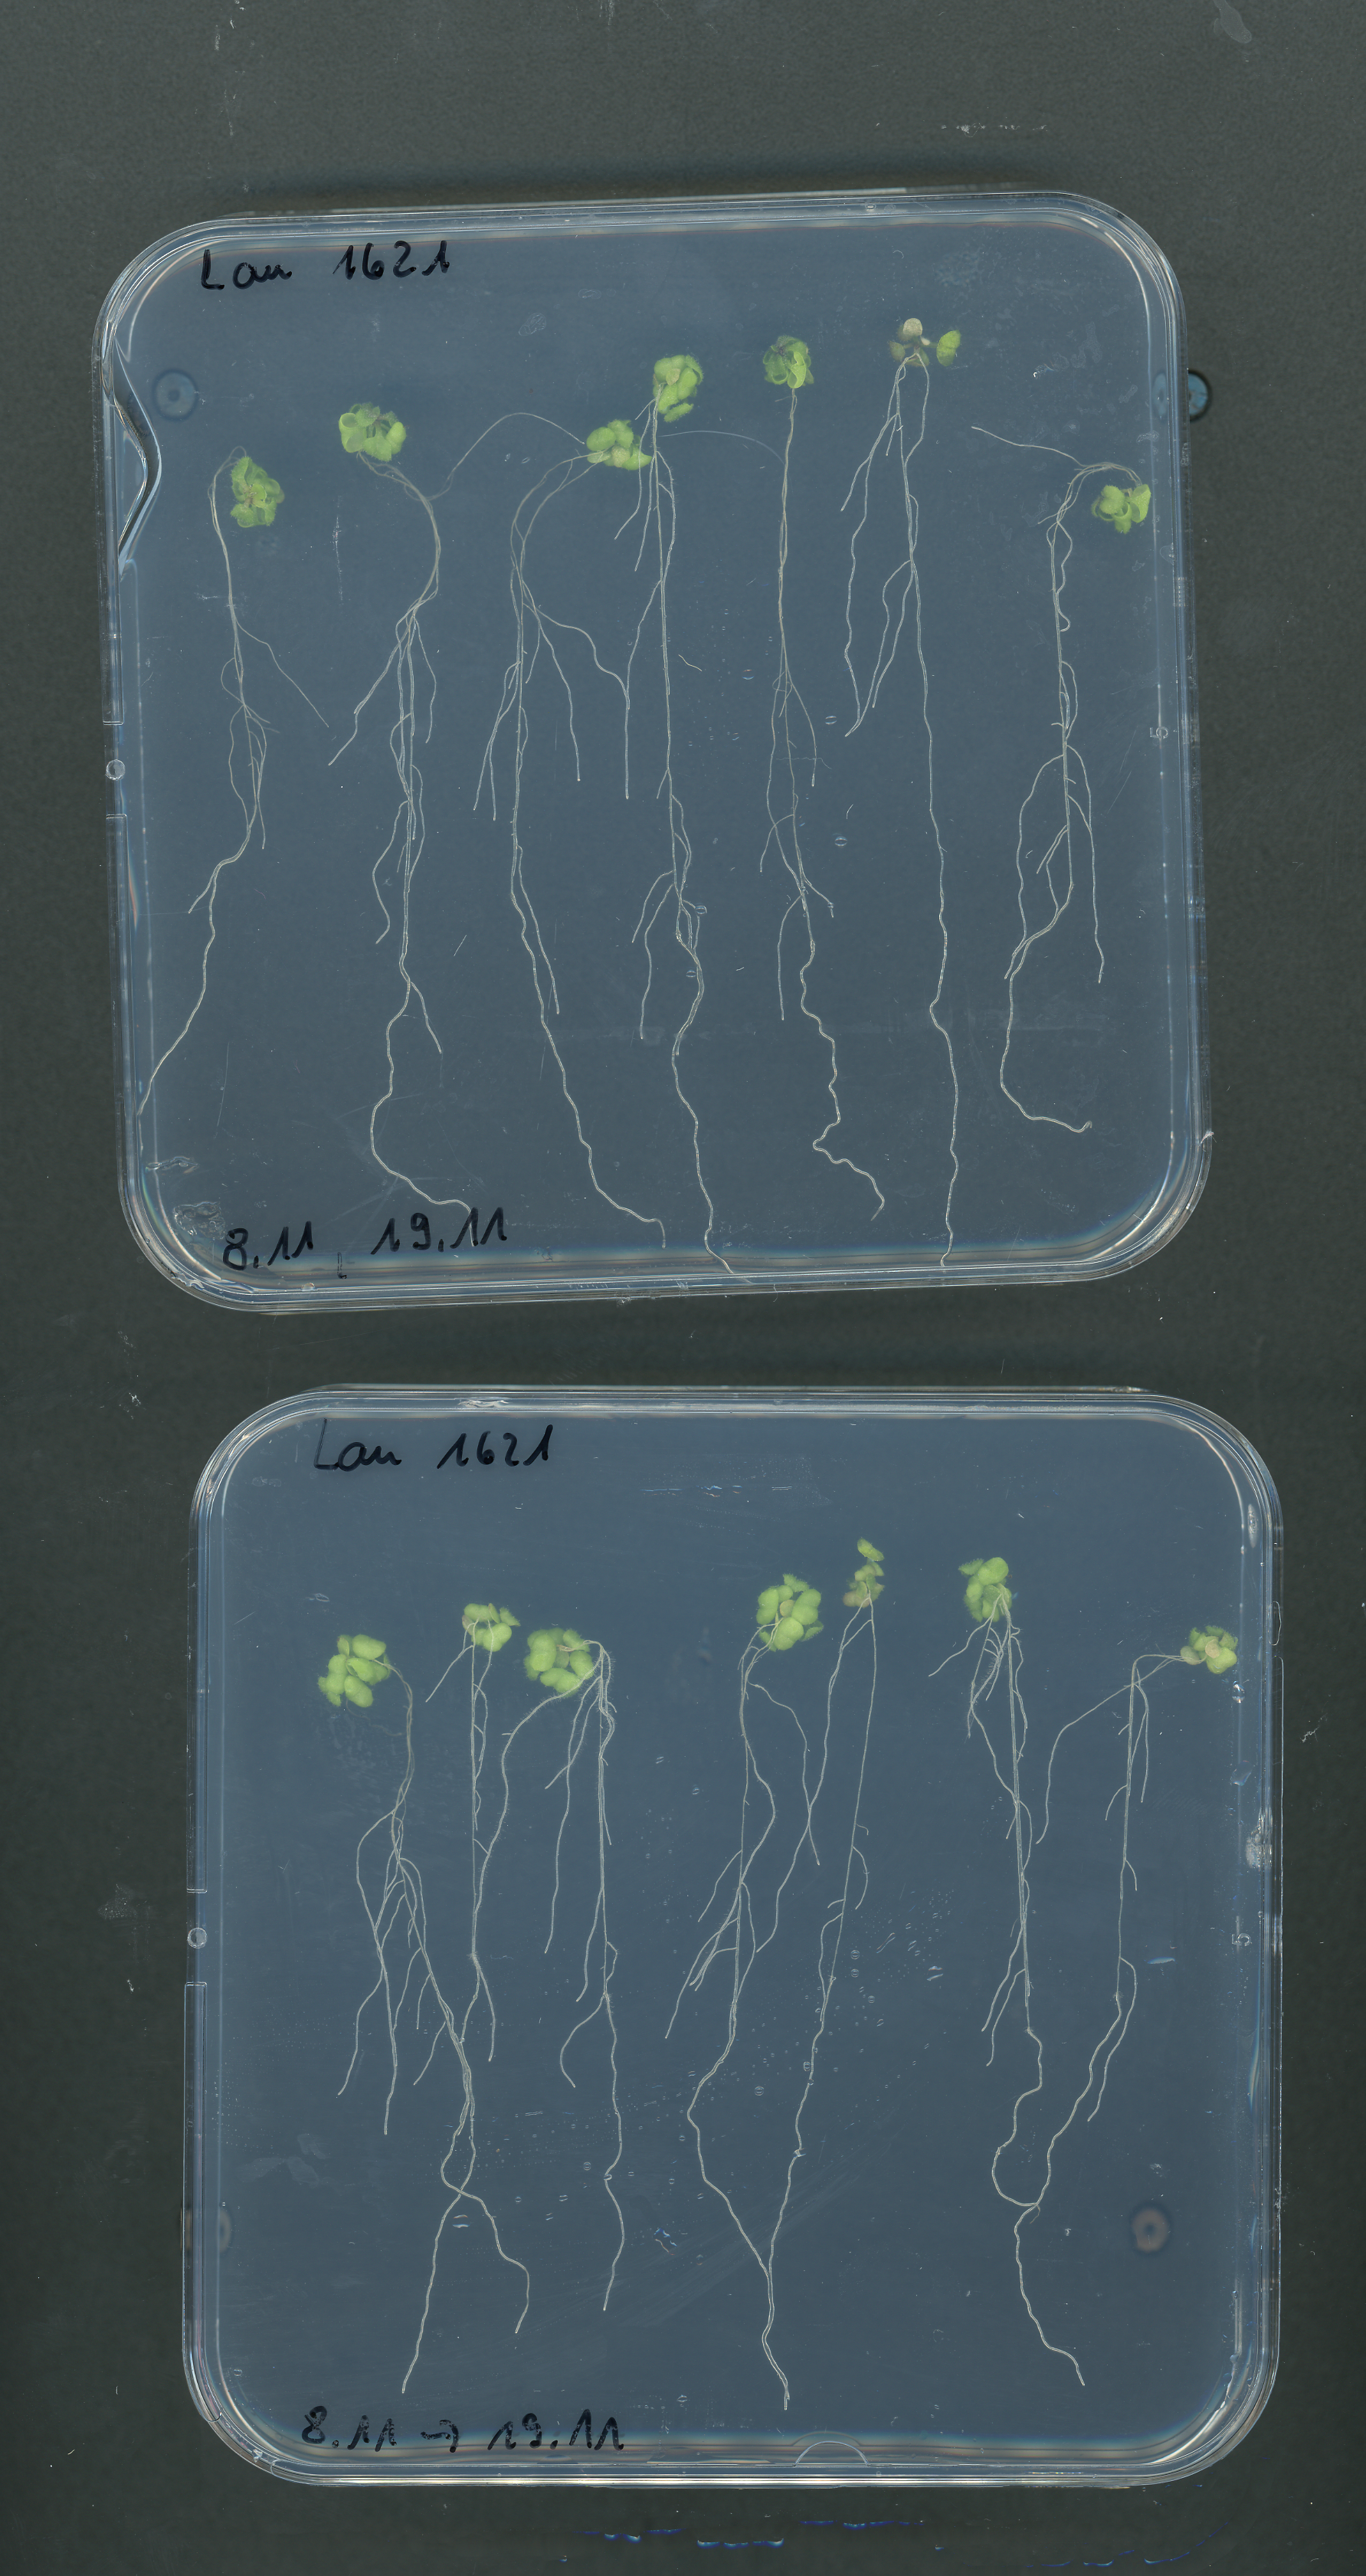
By taking images of the petri dishes at the end of the growth period, it was documented that there were obvious differences between wild type and mutant plats – it was clearly visible that mutants were smaller and differed in their growth habitus compared to the wild type. With the documentary images, a comparison with earlier or later tests, with other plant material, or with studies of colleagues are possible, and later re-assessments can be done. Thus image-based documenting is the first important step in digital phenotyping. Hereby, it is crucial to ensure adequate image quality – the better illuminated and undistorted the images are, the easier information can be derived.
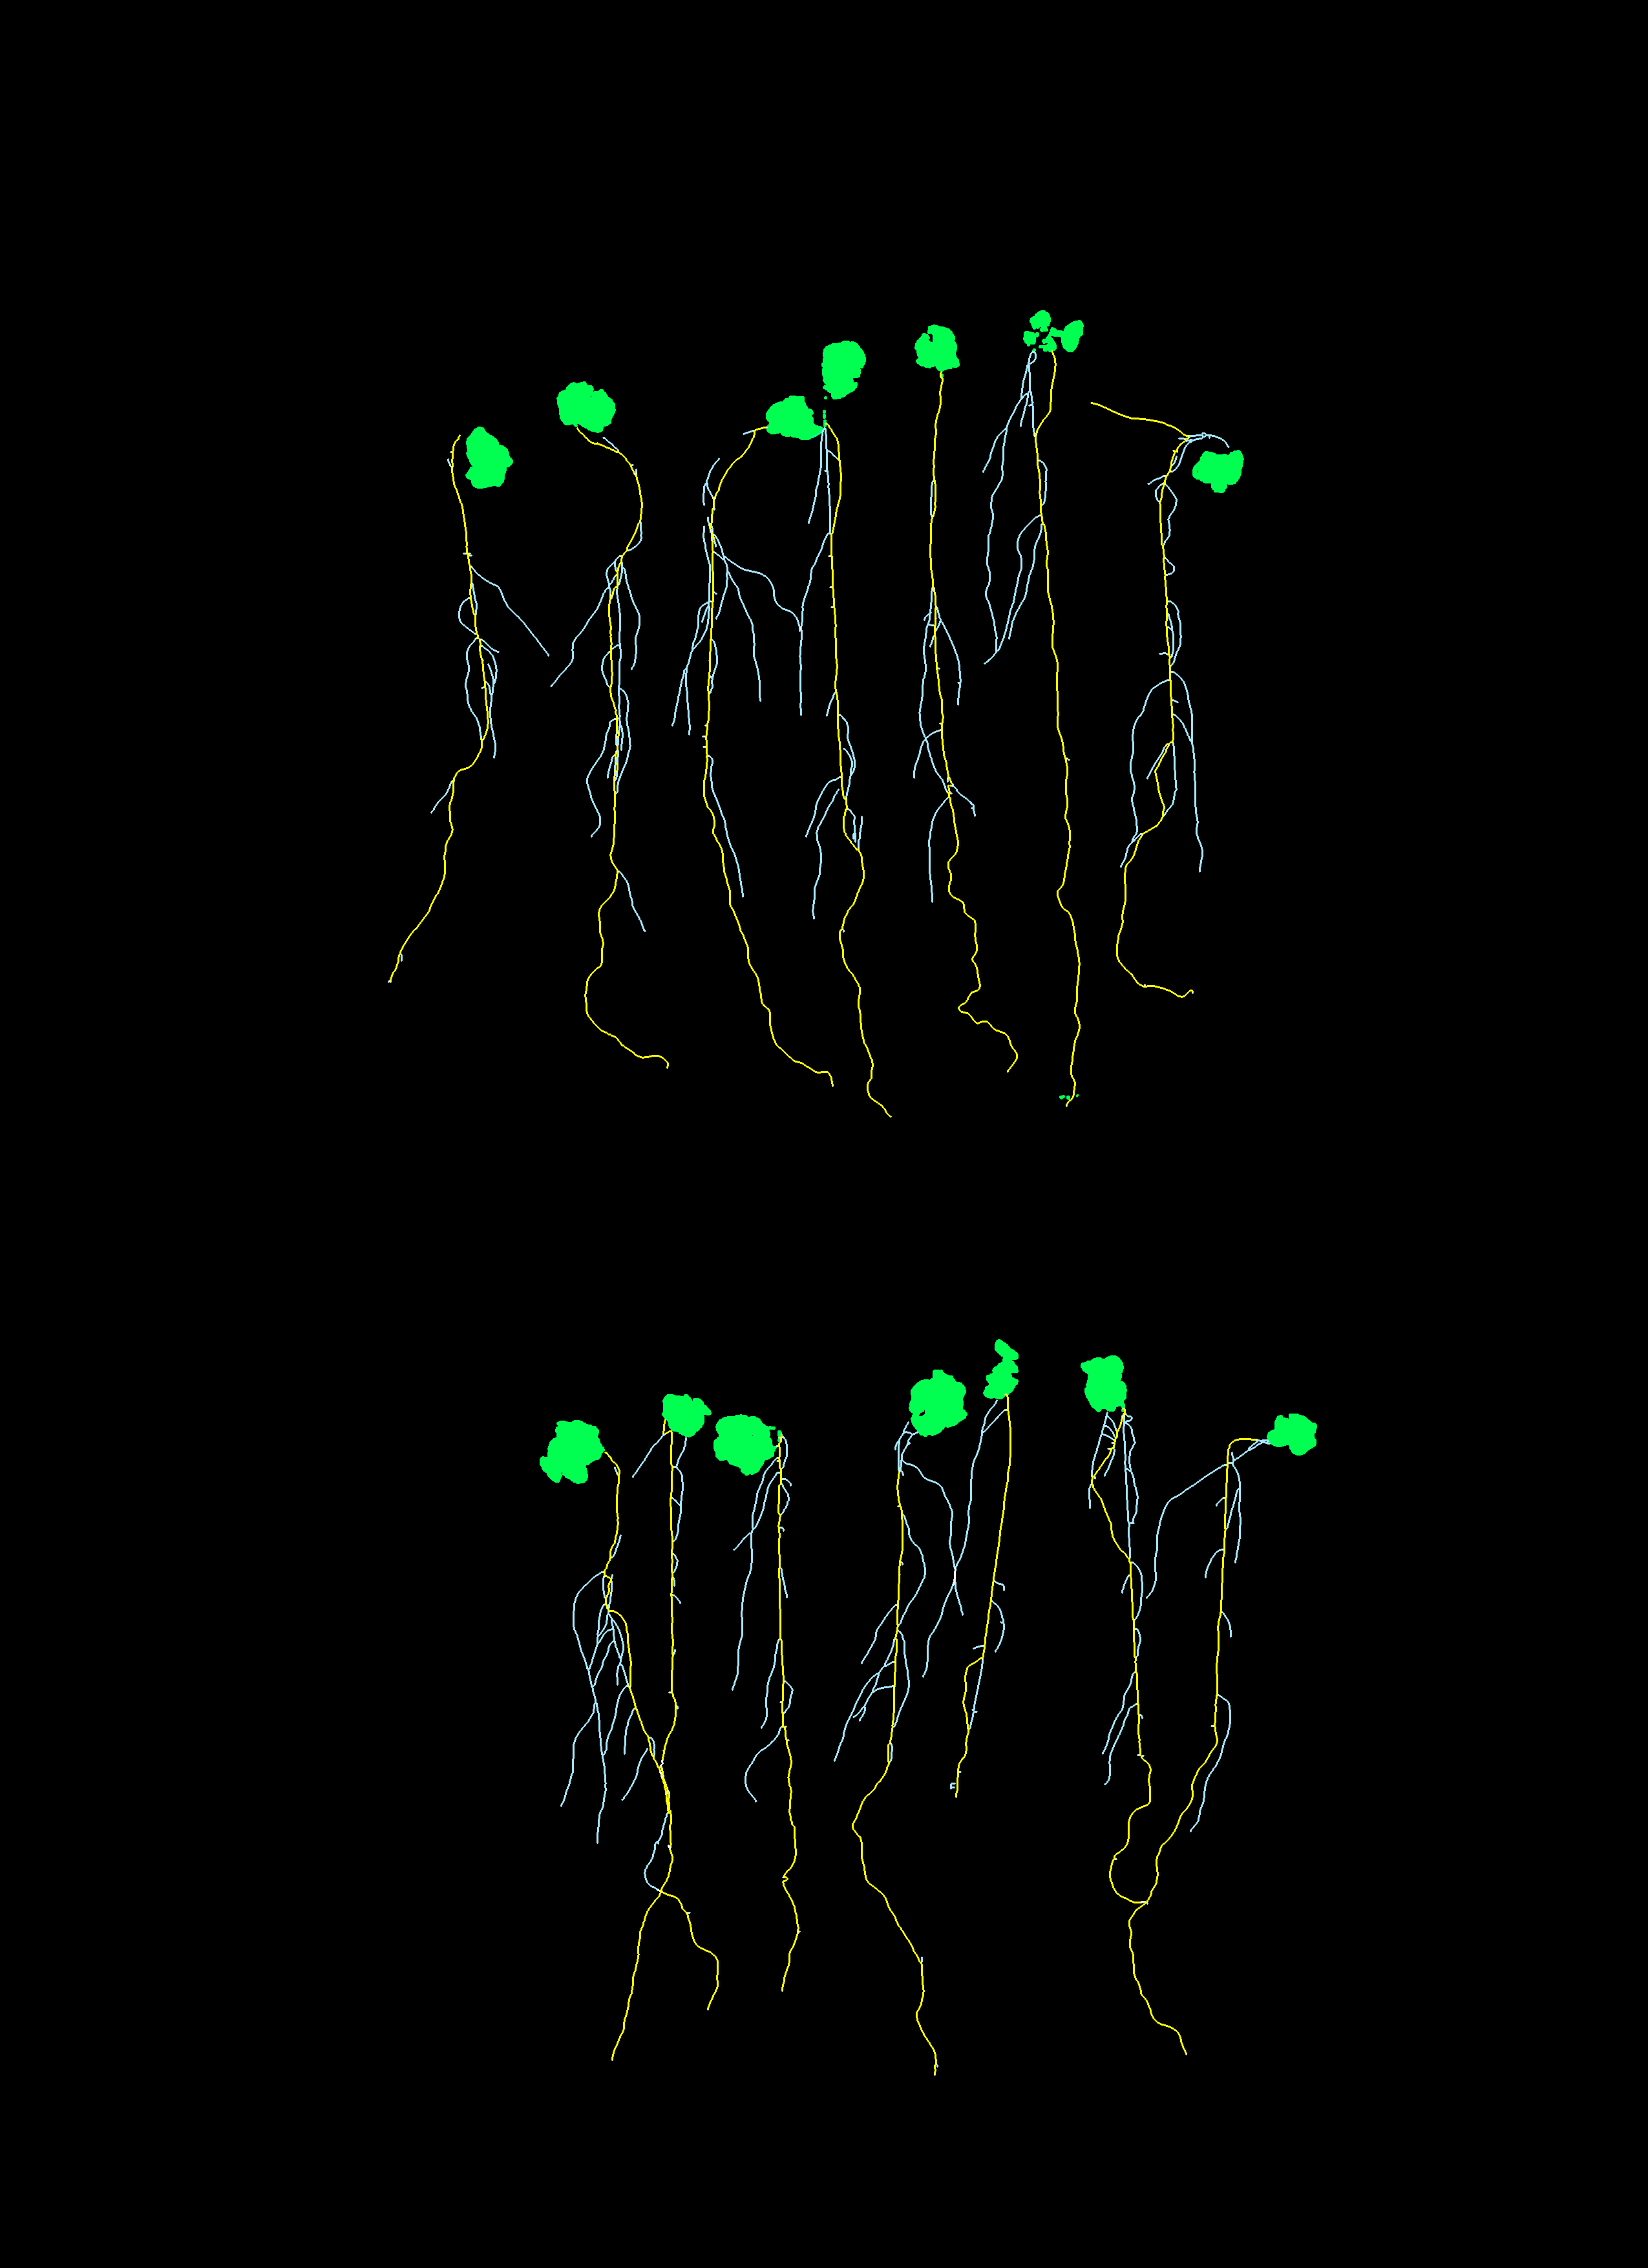
The core part of phenotyping is analyzing the images with image processing tools that derive phenotype-related information from the images’ pixel data. Carrying out a shoot and root assessment, the wild type and mutant plants were measured for dimensions and morphology.
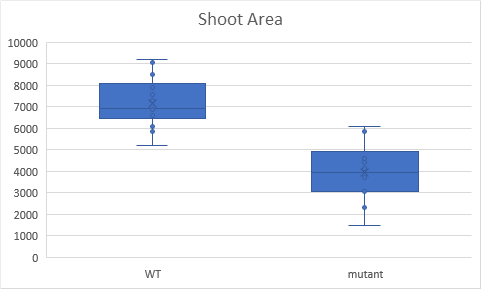
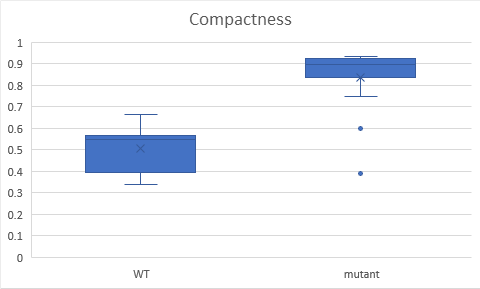
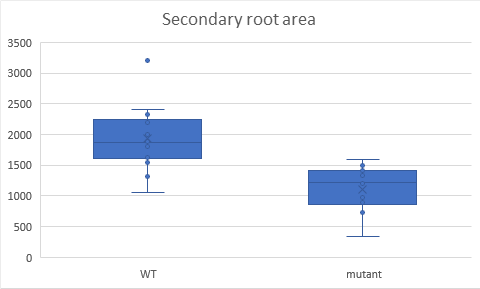
Numerical results of the phenotypic assessment revealed shoot- and root- growth depressions in the mutant. The shoot area of the mutant plants was much smaller compared to that of the wild type plants, they had only 55% of the size, similarly, the area of the secondary roots was reduced to 57% of the wild type’s size. In turn, the size of primary roots did not differ, the mutant had 105% primary root size compared to the wild type’s size. Together with the reduced shoot size, mutant plants were more compact growing compared to the wild types.
The corresponding graphs displaying the numerical data visualize that there was variation among 14 wild types and 14 mutants, meaning that there was biological variability within both groups. Thereby, extreme cases – large mutant individuals and small wild type individuals – fall into similar size ranges. This is a typical example for quantitative traits influenced by genetics and the growth environment. The mutation’s influence in plant growth is manifested in a decline of organ sizes, for shoots and for secondary roots. The decreased mean values of shoot and secondary root area are indicators for this. As each group consisted of 14 individuals, and individuals exhibited variations, the environment – here the position on the plates – could take an influence, too.
The example shows how documentary images and targeted image processing strongly supports phenotype assessments in gene function studies. LemnaTec offers adequate imaging systems for a broad range of applications, together with advanced image processing software for feature extraction.

