The versatile phenotyping system for laboratories – your entry to the phenotyping world.

The PhenoAIxpert product family combines powerful analytical software with a range of hardware options. Thereby it enables reproducible and standardizable results in plant research, breeding, product development, quality assessment, and beyond.

Features

  • Image acquisition, storage, and advanced image
    analysis including machine learning options
  • Metadata, annotation, and analysis directly linked
    to image
  • Intuitive graphical user interface
  • Advanced LED illumination options

  • The laboratory phenotyping system is available with
    industry-grade cameras combined with different lens
    options
  • Phenotypic data include count, size, morphology,
    and color, as well as application-specific features
  • Easy export of images and data

Download the “PhenoAIxpert” product brochure as a PDF document.

Application examples

Plant TrayPhenotyping Arabidopsis

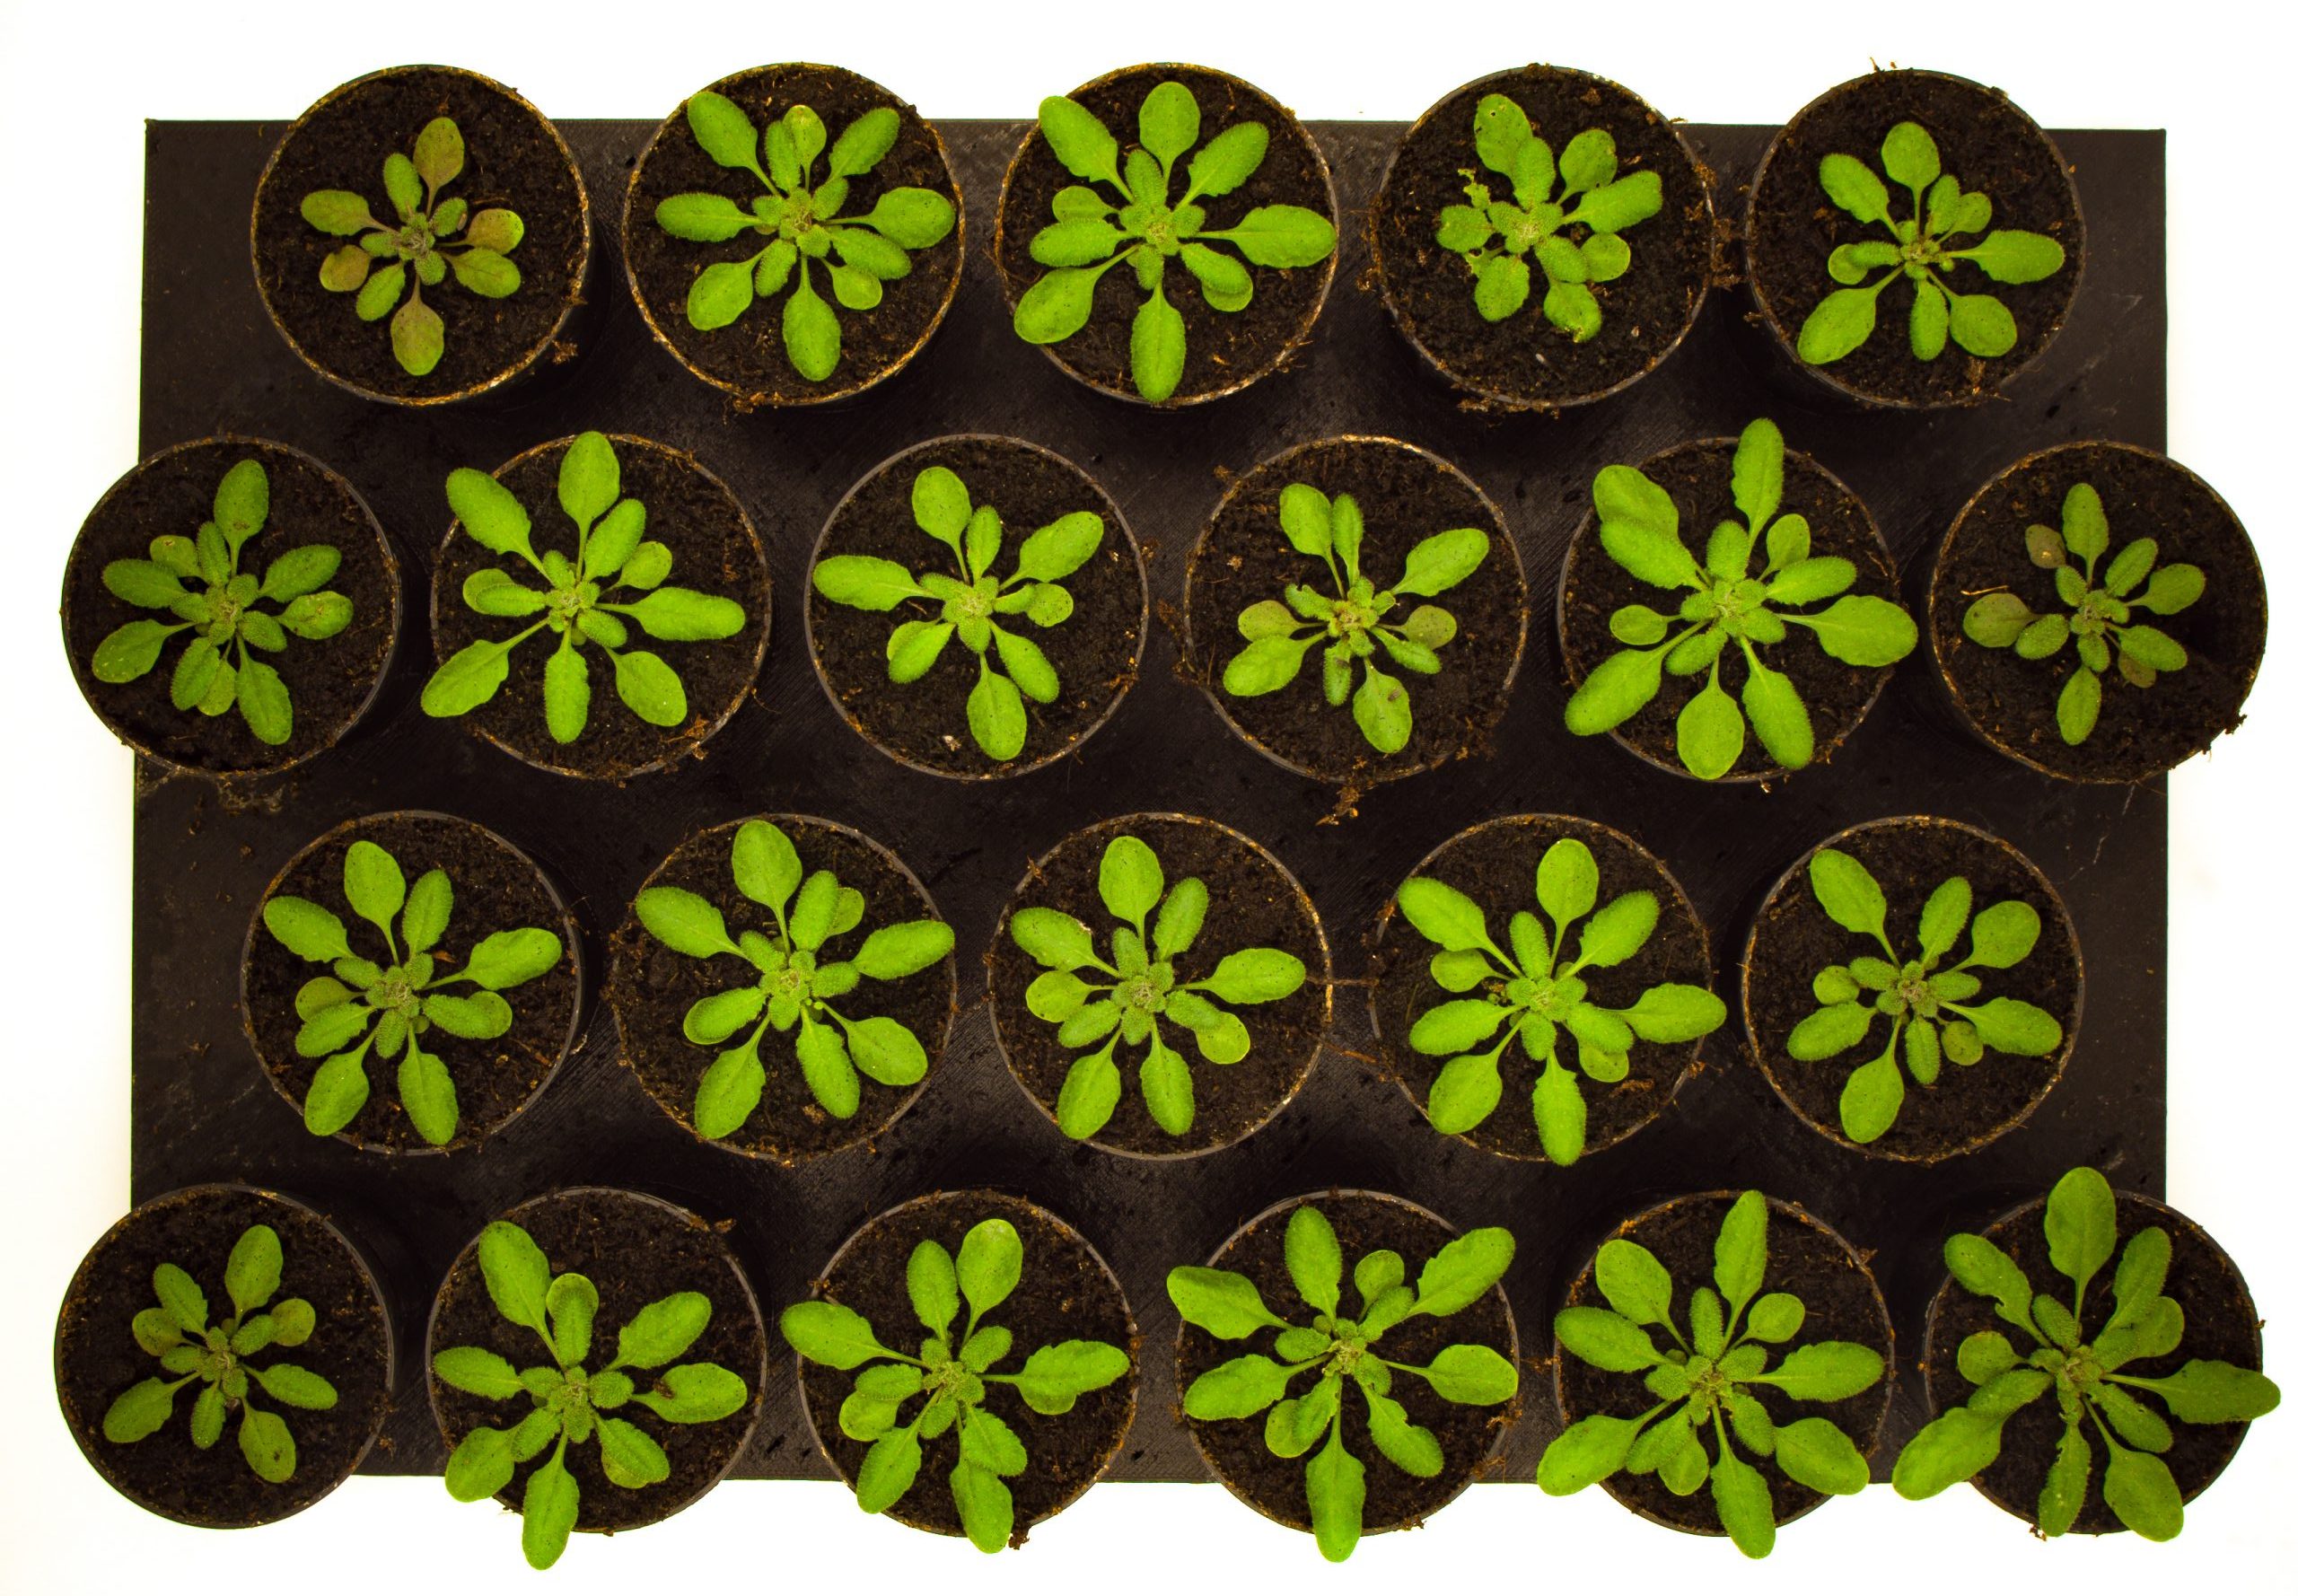
Arabidopsis growth assay

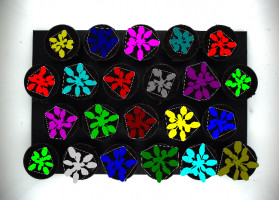
Trays with growing Arabidopsis plants were imaged with PhenoAIxpert and images were processed for plant growth, morphology and color. Individual plants were identified and phenotypic properties of their visible plant area were assessed. Such tests serve for e.g. candidate screening, genetic studies, treatment effects, environmental responses

Bean Phenotyping

Bean plants were exposed to stress and phenotyped for stress responses. Images were recorded and processed with PhenoAIxpert Pro. This system enables vertical and horizontal multi-view imaging. Phenotypic traits comprise growth, morphology, and color analysis, e.g. as stress indicator for chlorosis and necrosis.

Phenotyping Bean Plant

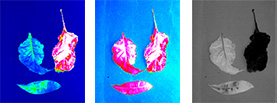
Multispectral imaging example with intact leaf (left) dead dry leaf (right) and stress-damaged leaf (bottom)

Red, green, and blue channel imaging – color-coded visualization of reflectance, channels allow calculating RGB images.

Multispectral imaging example with intact leaf (left) dead dry leaf (right) and stress-damaged leaf (bottom)

Combining red and infrared image (color-coded visu-alization of reflectance) to NDVI image (greyscale in-tensity of NDVI values: light-grey high NDVI, dark-grey low NDVI)

Root Phenotyping

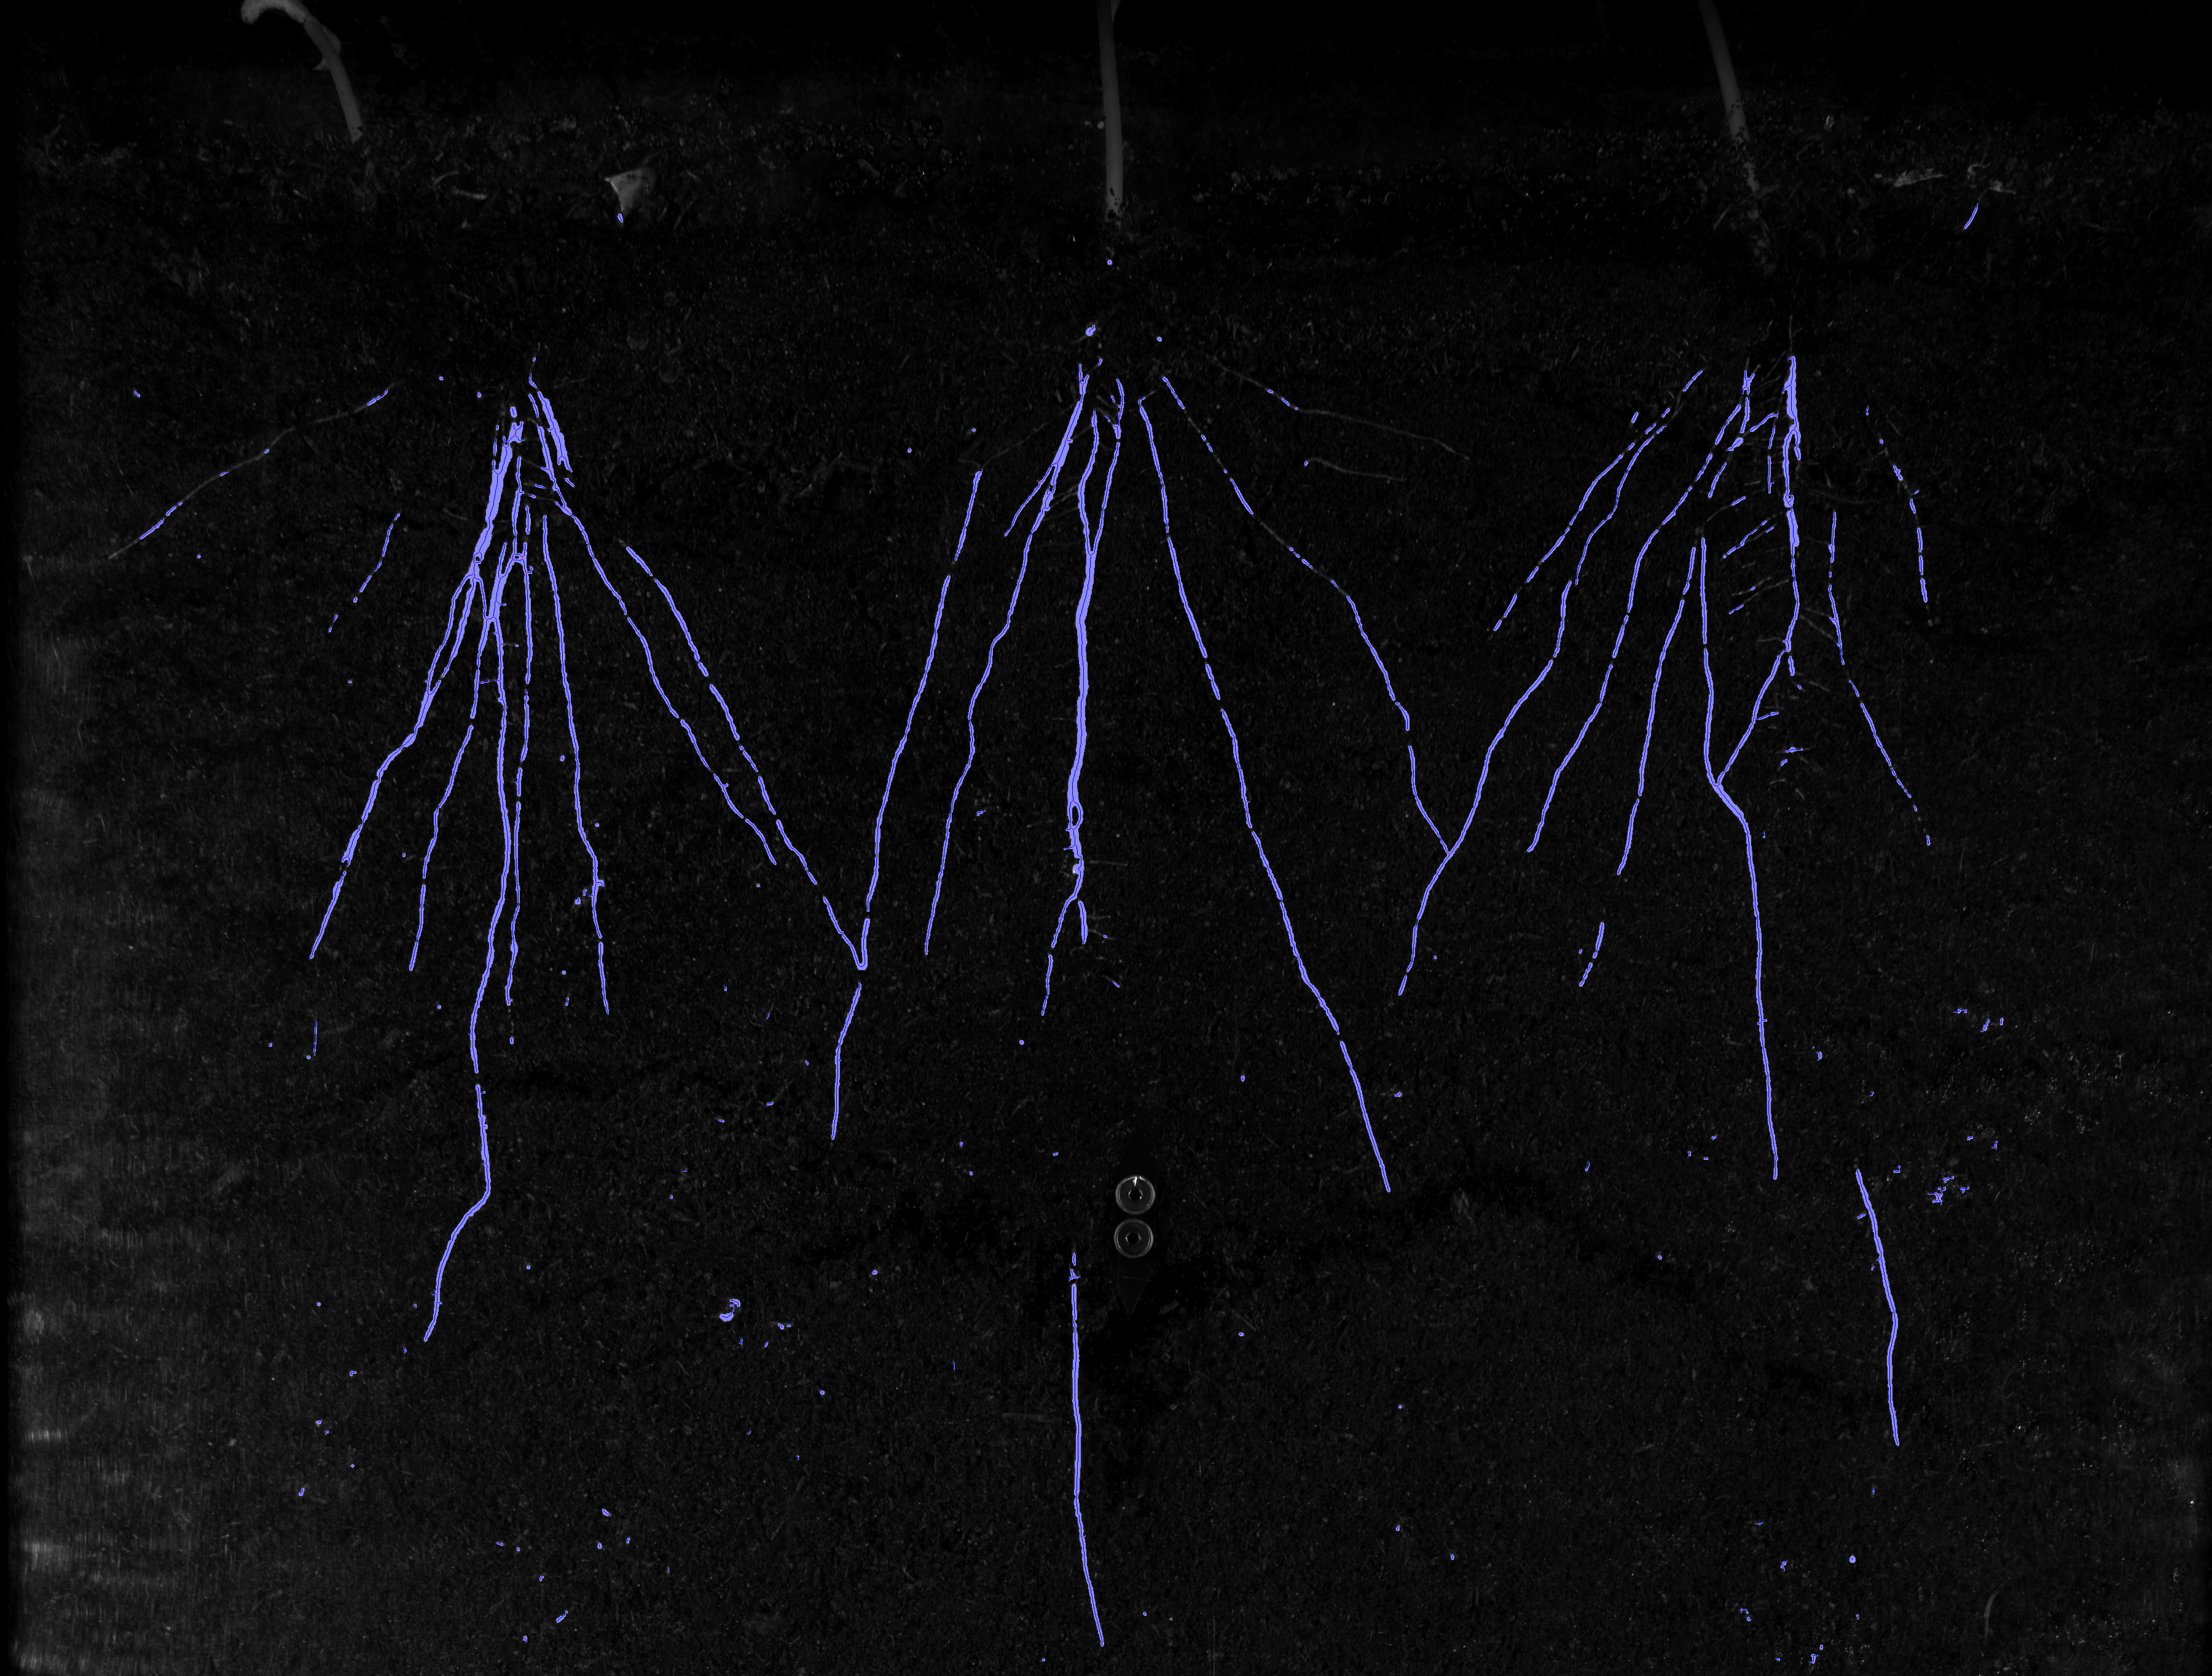
Using the PhenoAIxpert Root, traits of soil-grown roots in rhizotrons can be measured. Root properties like root lenght, root density, or root system lenght and width can be assessed.

Roots in Rhizotron at Growscreen RhizoRoots in Rhizotron at Growscreen Rhizo anaylsed with LemnaTec Software

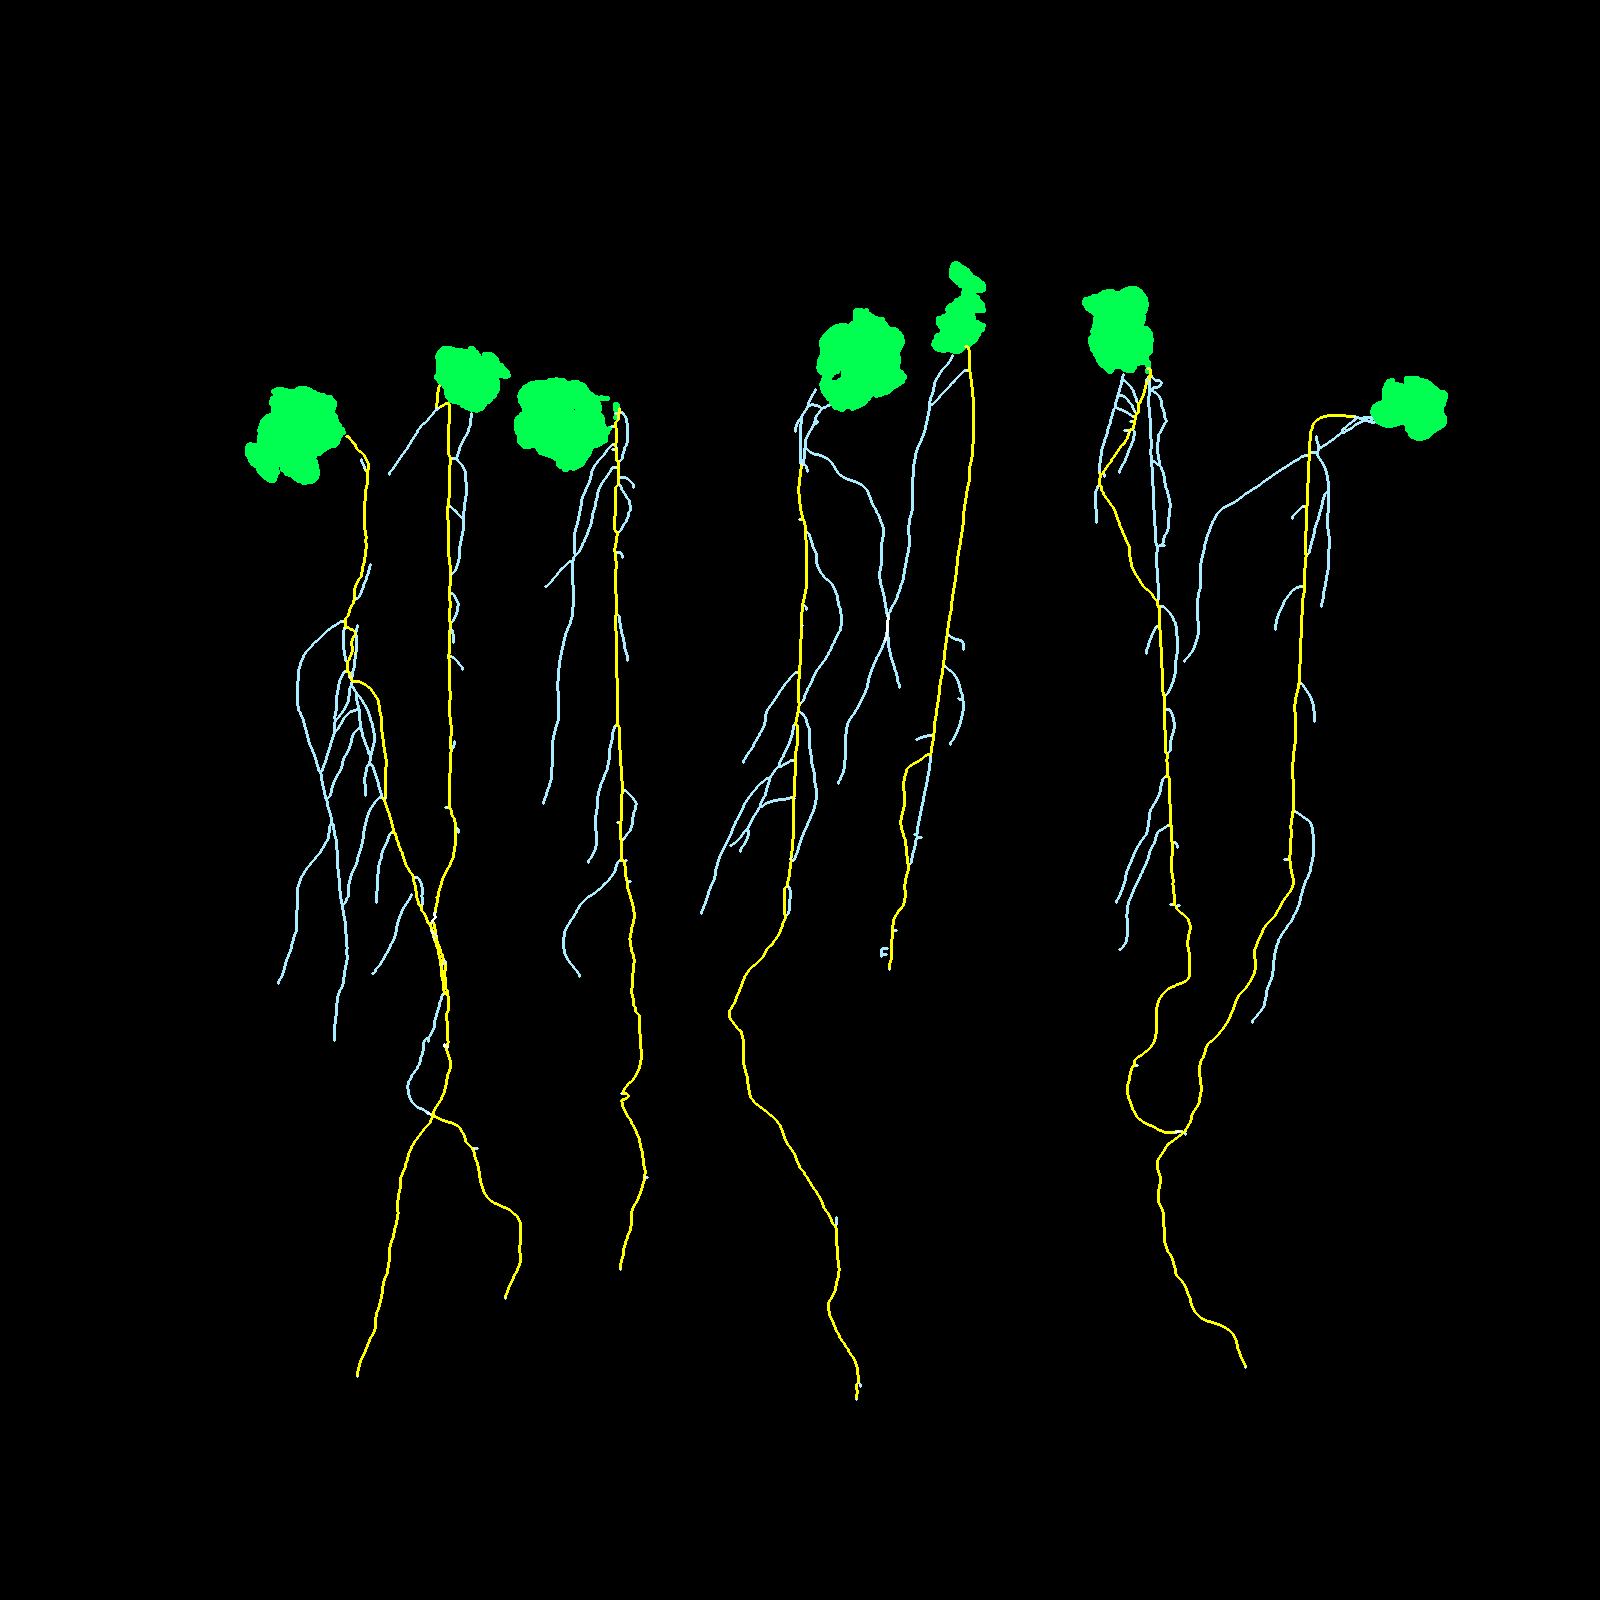
Phenotyping of seedlings on petri dish

Assessing shoot and root traits of agar-grown seedlings with PhenoAIxpert: shoots and roots are recognized separately and measured for their individual size. In the current example, primary root length, secondary root length, and shoot area were measured for each seedling.

Seedlings on Agar ImagingSeedlings on Agar Phenotyping

Imaging and Lighting

Phenotyping with RGB imaging

  • Minimum 12 MPix RGB industrial camera with prime
    lens for distortion-free imaging
  • Optimized white LED illumination
  • Top view imaging and phenotyping for seedlings, plant parts, petri dishes, MTPs, and other samples

Hardware Options

  • Sample stage as light box – for samples requiring
    transmission illumination
  • Additional sample holders for standard objects (MTPs, petri dishes, pots) – easy positioning of the samples
  • Barcode reader

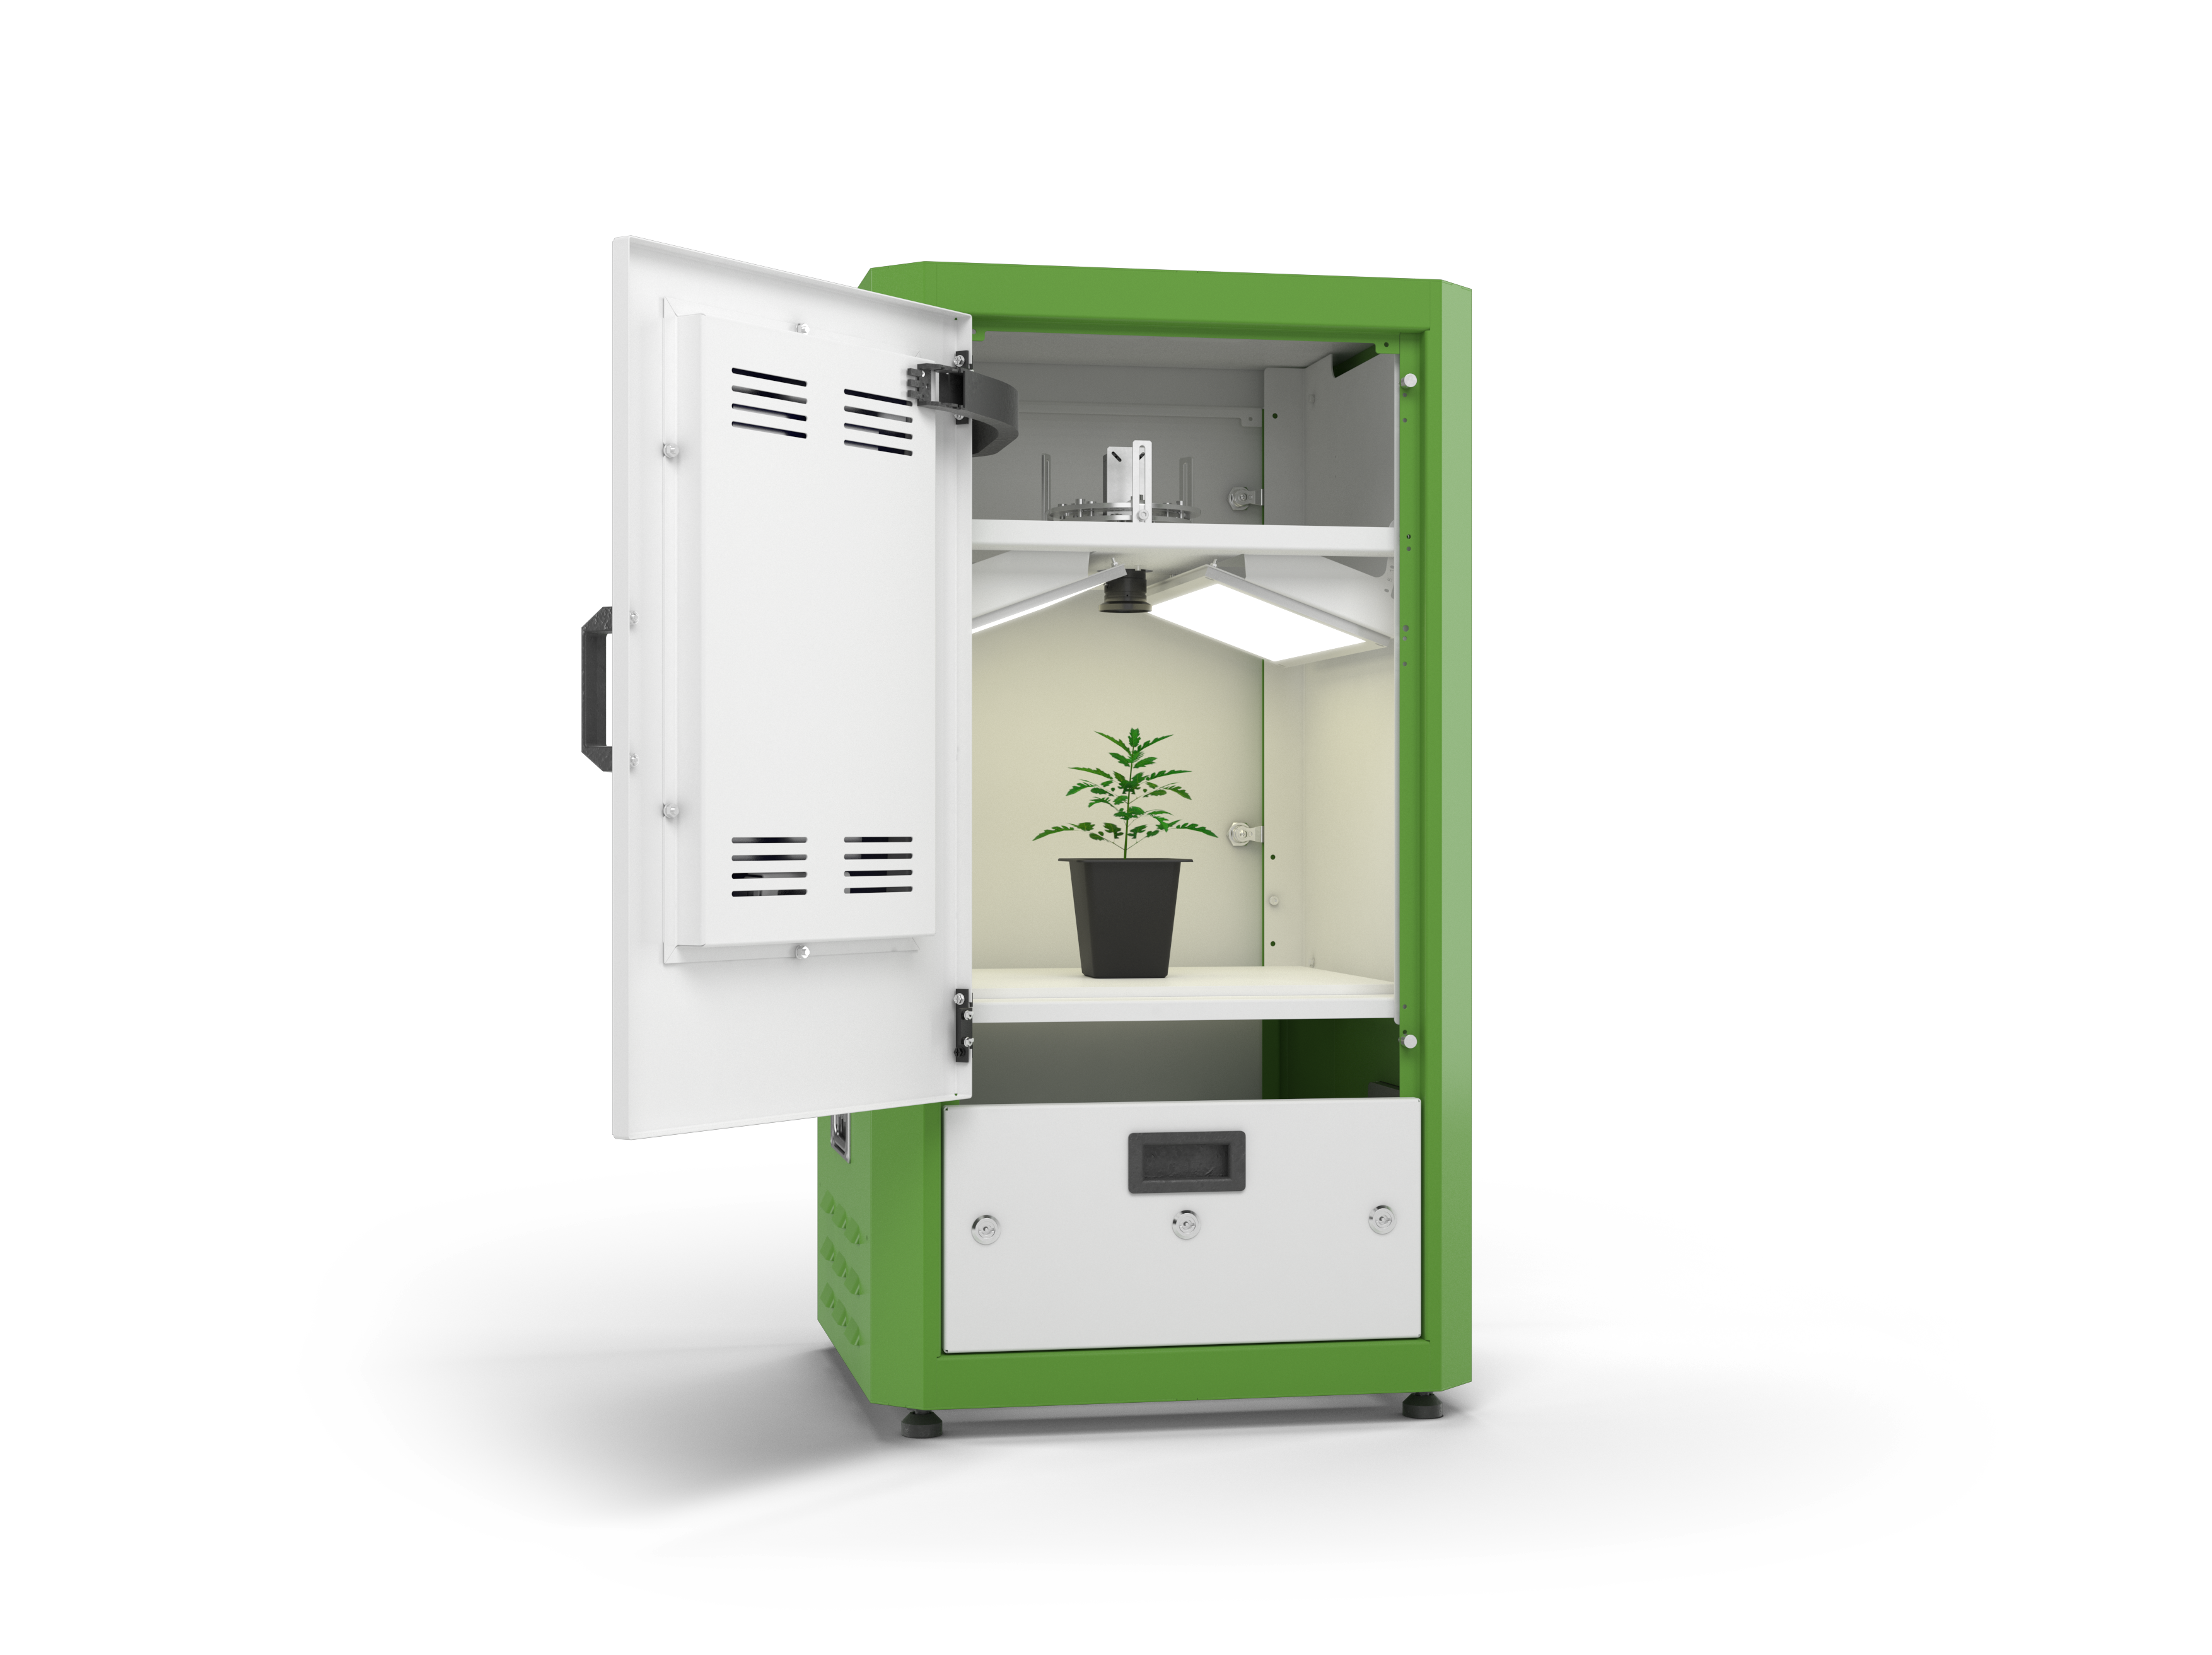
600 mm x 600 mm footprint
1115 mm height
Weight: approx. 85 kg

PhenoAIxpert cabinet

Future features

  • Cloud services

We bought a LemnaTec LabScanalyzer (the predecessor of PhenoAIxpert) in July 2018. The instrument was delivered to us and installed remotely by a Lemnatec technician that instructed us about the use of the instrument. We were happy about the service: very good communication and excellent instrument set-up. The Lemnatec LabScanalyzer works nicely and is even more user-friendly than we expected. Almost no training of new users is needed. We hope to expand the uses of the instrument to obtain additional phenotyping options in the future, by interacting with LemnaTec.

Prof. Pierdomenico Perata, School of Advanced Studies, Pisa, Italy, Institute of life science

Software Suite

The PhenoAIxpert is delivered with a comprehensive software suite. The software enables the users to provide sample information and control cameras and lights. After imaging all data are stored and accessible for image and data processing. LemnaControl is the interface with which users operate the system. With LemnaControl, users carry out all settings that are required for image recording with the system. In particular, his comprises settings for the camera(s) and lights included in the system. All settings can be combined and scheduled to configure recordings. The available functions are tailored to the corresponding hardware. Each hardware system delivered by LemnaTec comes with its own control software adapted for the functions of that system. The LemnaGrid app uses an intuitive graphical programming environment, which allows for easy integration of different image analysis algorithms. LemnaGrid phenotyping software offers high flexibility for user programming. The image processing pipeline extracts desired properties/features from the original image and stores results in a dedicated storage system. LemnaGrid can include functions of state-of-the-art machine learning tools, next to standard image analysis to detect and extract features of interest. Guided by the LemnaGrid graphical user interface, users can build their own analytical pipeline with pre-defined devices.

Analysis devices include:

  • filters
  • threshold functions
  • image converters
  • object detectors
  • feature detectors
  • color analysis tools
  • region of interest function
  • combinatory functions
  • and many more

All devices – graphically represented by boxes – can be combined on a interface by aligning the boxes to pipelines. Along such workflows, each function can provide insights in the progress of the analysis by feeding out an intermediate image. Image processing pipelines can include branches and parallel paths that combine to a final result. For 3D data, the app Lemna3D is used for programming analytical pipelines. Similarly as in LemnaGrid, users can do graphical programming on an interface by combining devices from a library of functions.

LemnaExperiment serves to manage experiments and measurements, and to schedule and run analyses. Moreover, it enables viewing, visualizing, and exporting results. It provides capabilities to access and browse through recorded images and to display metadata for samples and measurements. As core function, LemnaExperiment selects recordings for analysis and assigns an image analysis pipeline –written in LemnaGrid or in Lemna3D – to a given set of recordings. After assignment, the analyses are run in the background by the Analysis Executor. Parameters of interest can be selected in LemnaExperiment so that they are displayed in the analysis output.

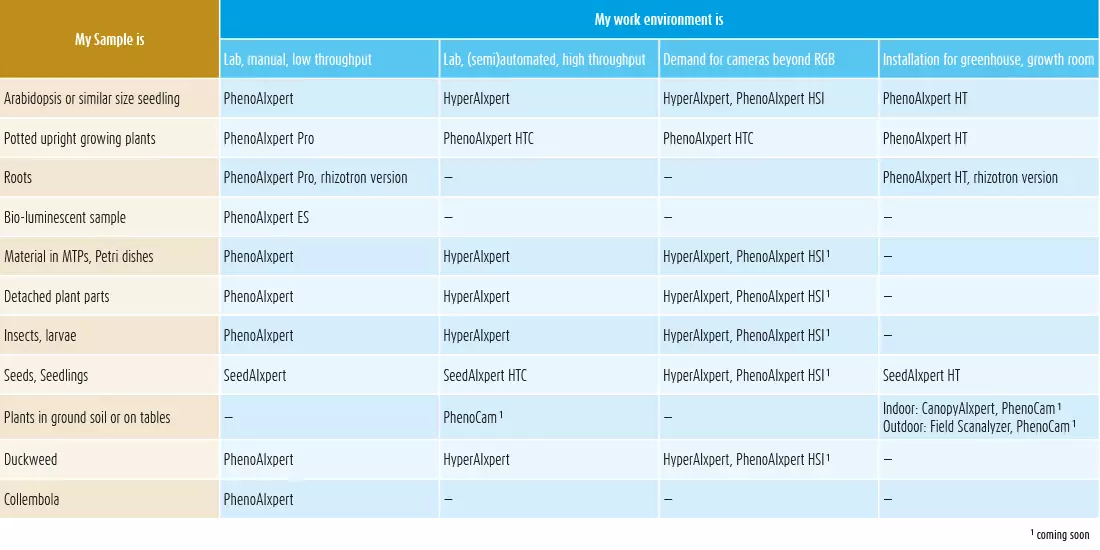
LemnaTec Product Matrix

LemnaTec offers imaging and image processing technologies for several applications that suit for low to high throughput in laboratory, greenhouse or outdoor environments. Technologies are adapted to various sample types and can be combined with automation. All imaging systems are combined with dedicated image processing software, including user-programmable functions and machine learning.
Ask for a quotation or additional information