Phenotyping small emerging seedlings
In plant growth and performance studies as well as in seed quality assessments, the earliest growth stages in seedling emergence, cotyledon unfolding, and cotyledon growth are important features.
When seedlings emerge from soil, cotyledons are small and initial stages are hard to find between soil particles that might be even larger than the young plants. Frequently, the growth substrate is heterogeneous, and water supply can introduce additional color deviations in the soil. In an analysis it is important to capture young stages of plants as early as possible, thus the image analysis software must be able to discriminate seedlings from all background particles.
With high resolution, distortion minimized images and accurate phenotyping software, LemnaTec PhenoAIxpert can deal with such challenges. The analytical software – our LemnaGrid package – separates the plants from the background and recognizes the plants as single objects. All detected objects can be measured for various factors.
For such a multi-pot tray, key steps in the analysis process are:
- locating the pot areas
- color segmenting the image
- object identification
- determining and storing geometrical parameters of the objects.
After this process, results are not only given as visualization, but also as a numerical data table that can be used for data visualization and statistics.
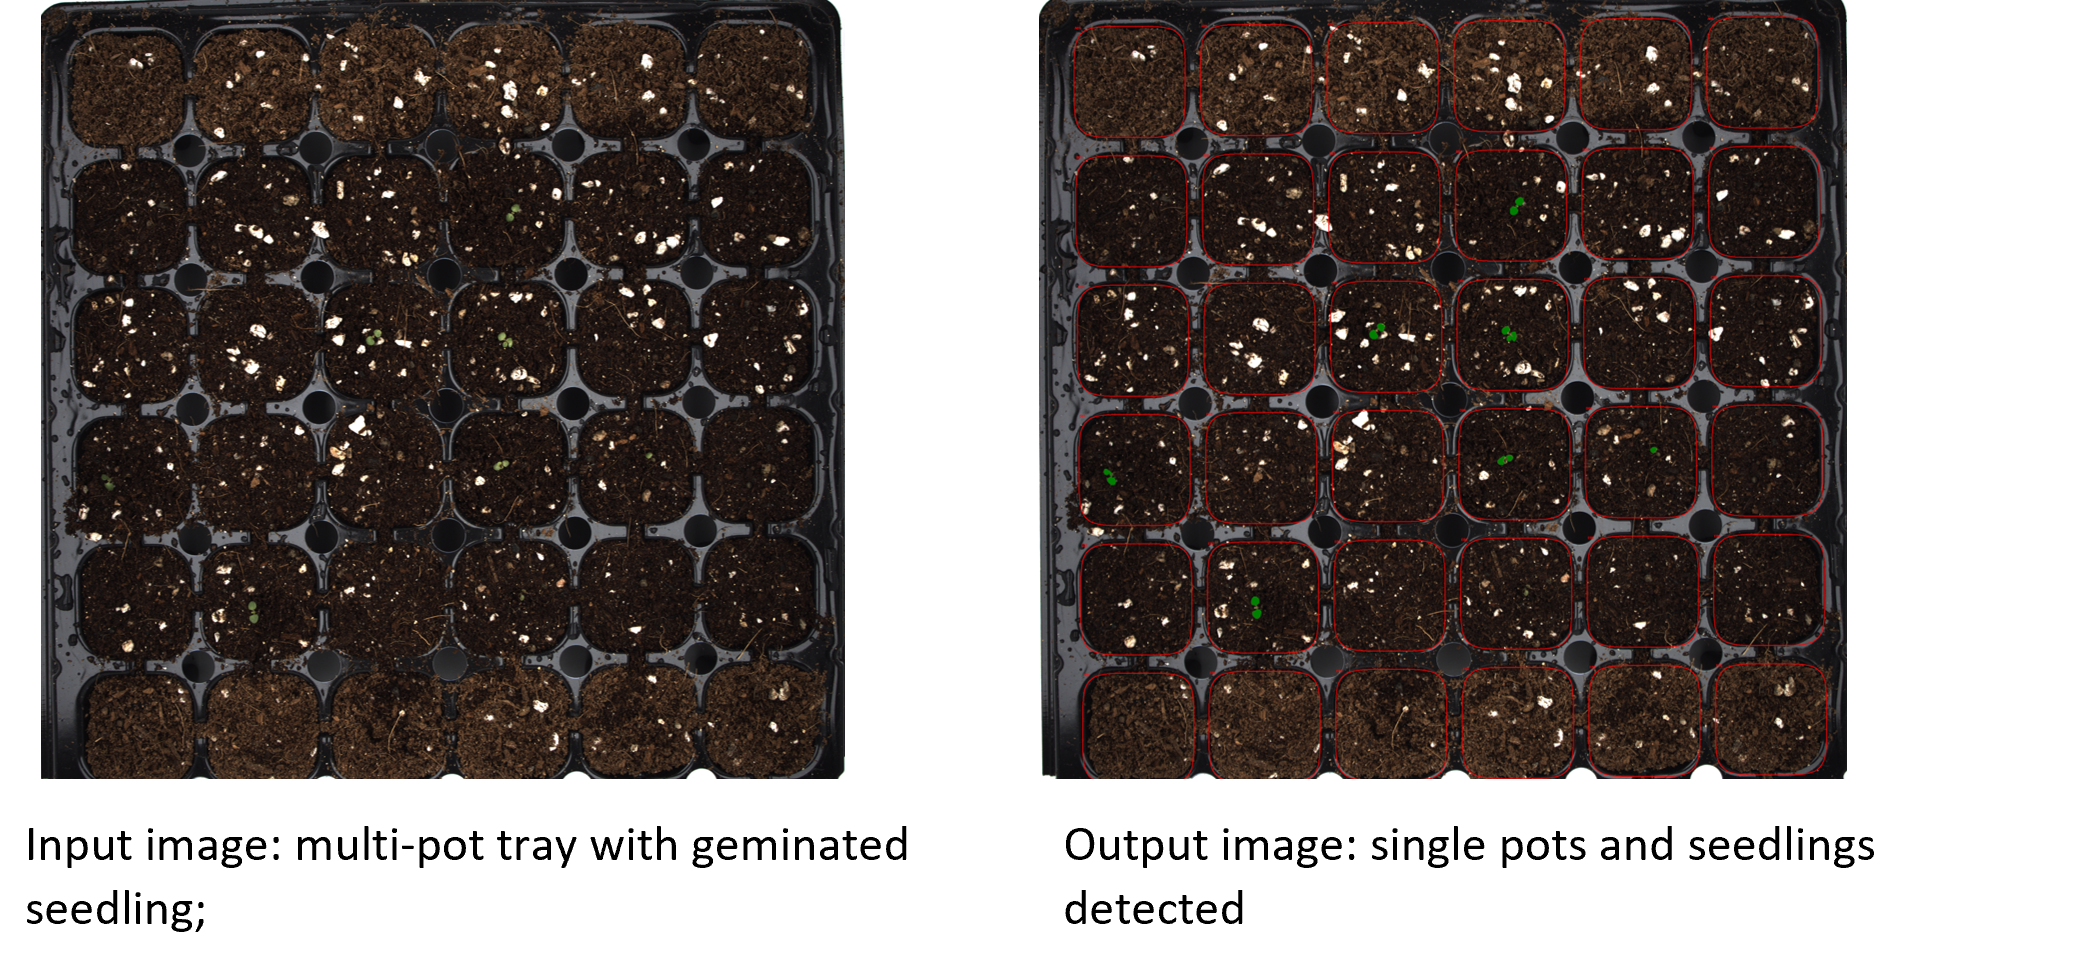
Processing the input image with LemnaGrid, all seedlings were detected and measured. The LemnaGrid provides tools that enable separating the plants from even challenging background materials.
In the example case, only few seedlings have started emerging from the pots filled with heterogeneous soil, and inequal water supply made an extra challenge as dryer soil is much brighter than the wet one. Our LemnaGrid software has detected seven seedlings in the 36 pots. Thus, the emergence rate is 19.4%.
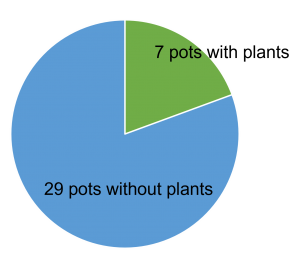
In seedling analysis, the fraction of emerged seedlings is a key feature for seed quality determination. Thus, the seedling emergence rate is an important descriptor for quality.
While the seedling count would be available with a visual inspection, too, our image processing software delivers dimensions of the seedlings in one run, together with the count. Thus, the automatic inspection provides added value, because the measurements of the seedlings can be used to assess seedling growth performance, in particular once image series of one sample are taken and the temporal development is analyzed.
In the current example, seedling sizes show how the plant sizes differ within the sample. This information can be used for e.g.
- Rating the seed batch quality in terms of germination frequency and homogeneity
- Determining phenotypic properties of the seedlings, for instance as a result of genetic properties of the observed lines
- Assessing environmental effects, given that the tray was subjected to a treatment
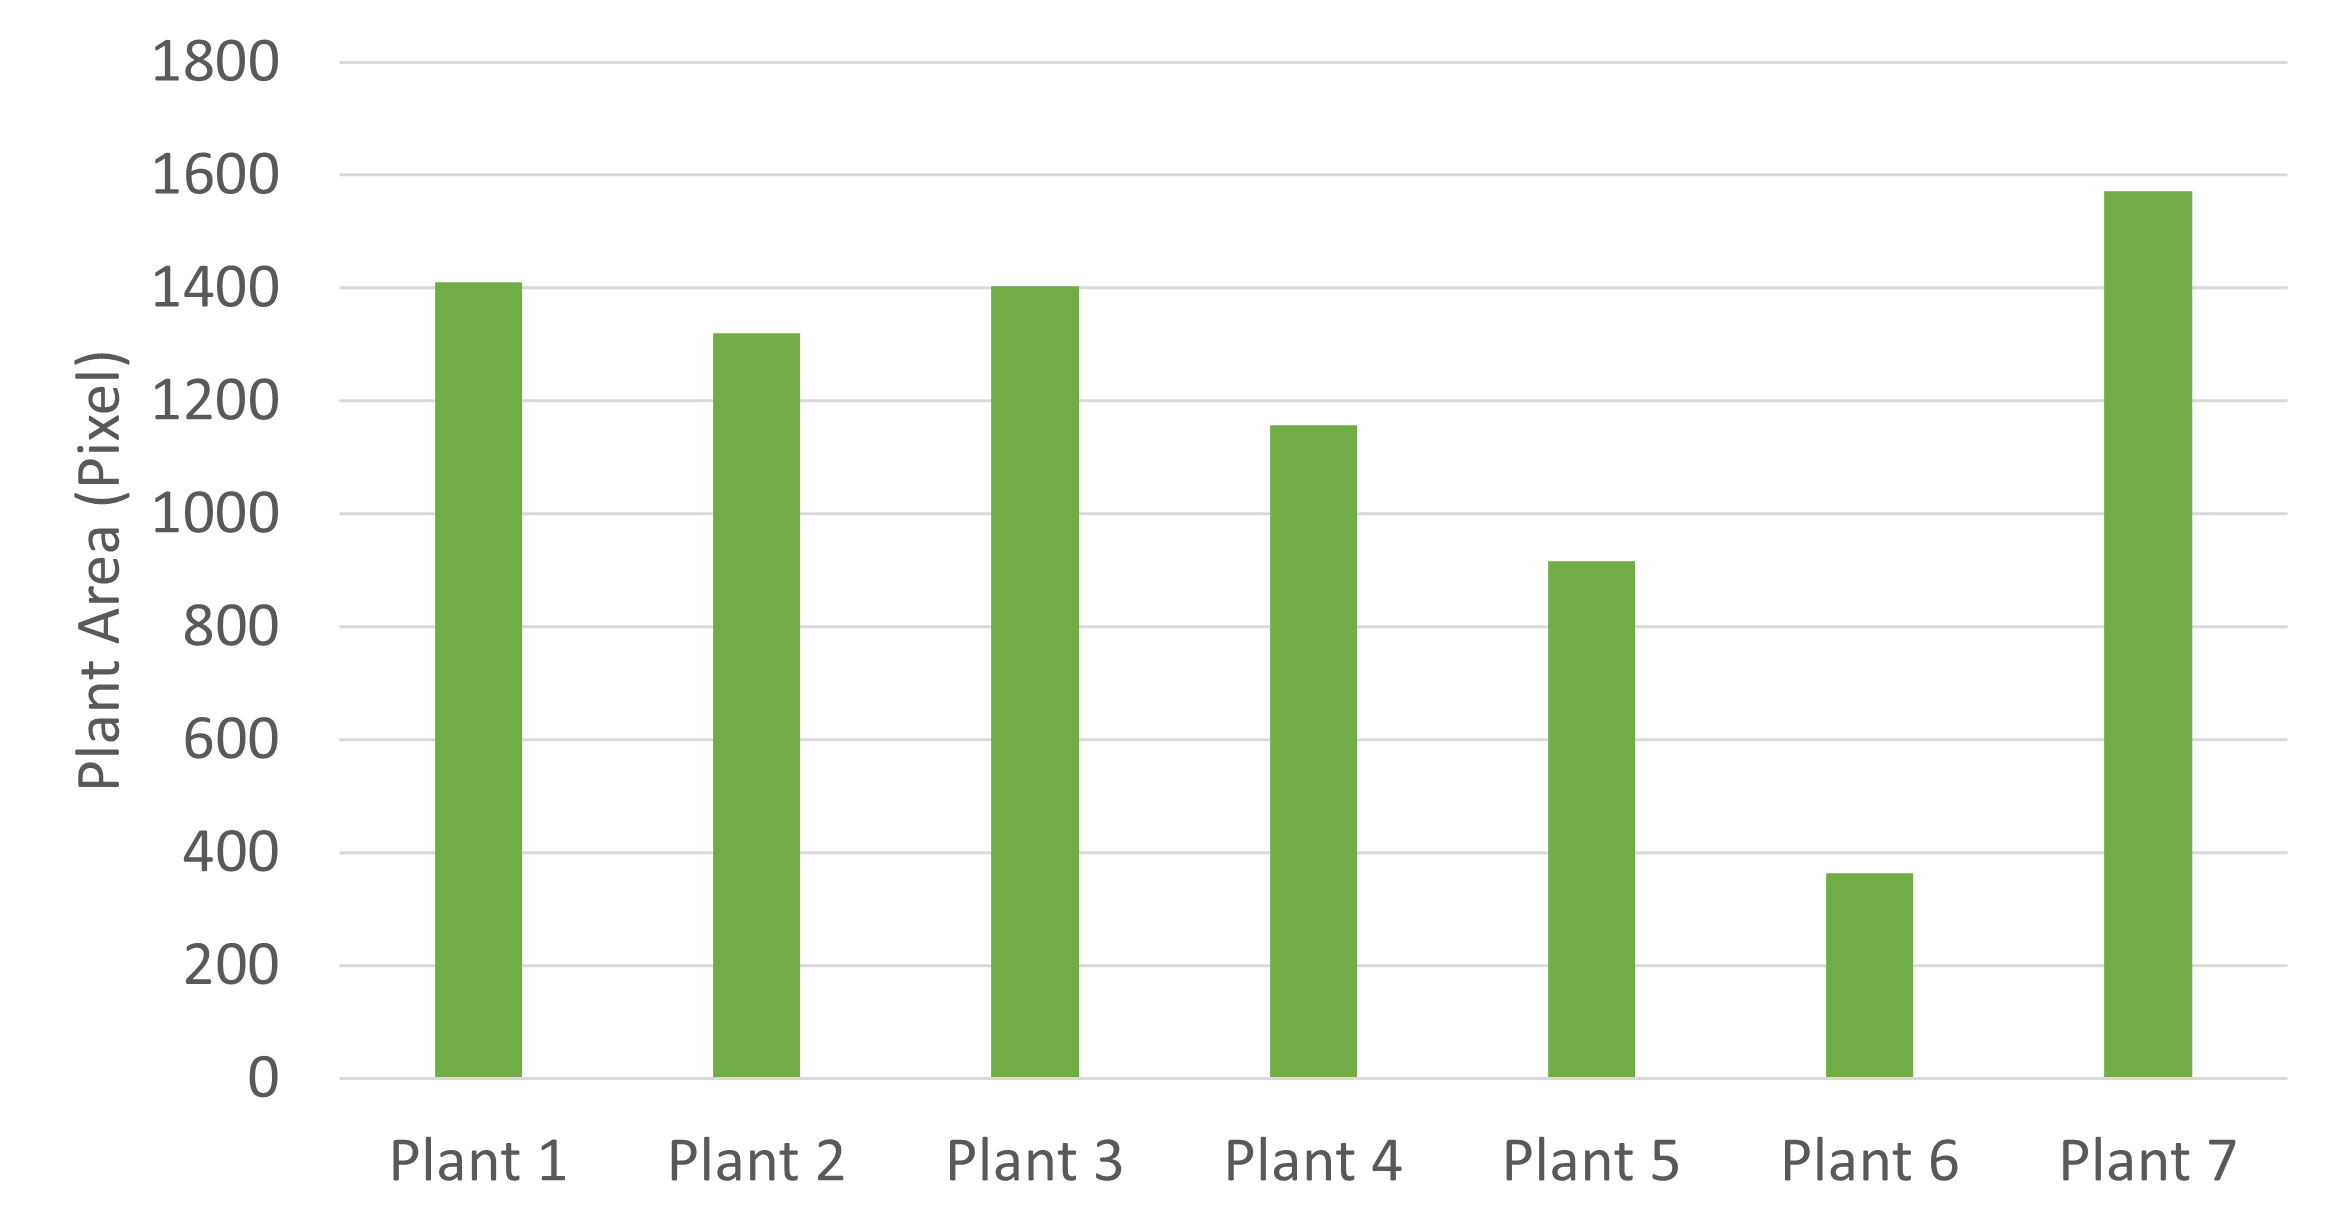
As a result of seedling phenotyping, size of each plant is measured so that the individuals of the group can be compared. Once recording such images in time series, temporal changes of size serve as growth descriptors.


The challenge: tiny seedlings emerging from inhomogeneous soil, including white particles that partially are placed directly next to the plants.
Task: detect and measure all seedlings.

The LemnaGrid software has a graphical user interface where devices, i.e., pre-defined functions in image processing, can be combined to image processing workflows. These functions enable stepwise analyzing images with the aim to segment target objects and measure their properties.

Using the LemnaGrid toolbox, target objects – the plants – are separated from the background. In a cleaning step, all non-plant objects are removed and each plant is identified as an individual object that is measured.

The overlay with the input image shows that LemnaGrid correctly detected all seedlings and assigned them to the pots.